1. Assessments and Dashboard Reports
The results on a Dashboard Report come from assessments, calculations that each answer one structural question about an asset, such as how much fatigue life a location has used. This article explains what an assessment is, how its result reaches the Akselos Portal, and how to read it, with examples from three refinery assets.
Structural Performance Management (SPM) is the system Akselos provides. It continuously calculates the real structural limits of critical infrastructure from operating data, so you can safely increase throughput, reduce downtime, and extend asset life. It does this with Physics AI and high-fidelity structural twins that show how the steel actually responds under real conditions.
SPM connects operating data, inspection records and design information into one structural view. Engineers and operators can see how each asset responds as conditions change, and base decisions on evidence.
2. What Is an Assessment?
An assessment is one calculation that SPM runs on the structural twin of an asset to answer one structural question. Every assessment has three parts:
- Inputs: the data it is calculated from.
- A limit: the published standard, such as API 579-1/ASME FFS-1, or the limit curve that the result is measured against.
- A result: a value for every assessed location, calculated again as new operating data is processed.
Each damage mechanism has its own assessment, and one asset can be assessed for several. Table 1 lists the assessments SPM runs, with examples of the assets each one applies to.
Table 1. Assessments SPM runs, with examples of the assets they apply to
| Assessment | What it calculates | Asset examples |
|---|---|---|
| Fatigue | The damage that repeated loading cycles accumulate, and the life that remains | Coke drums, reactors, deaerators, vaporizers |
| Creep | The damage that sustained load at high temperature accumulates over time | Steam methane reformers, fired heaters, natural gas pre-heaters, heat recovery steam generators |
| Minimum pressurization temperature | How close the stress comes to the allowable stress for the current temperature, through startup and shutdown | Hydrocracker reactors |
| Metal loss | Whether a vessel or line stays fit for service as corrosion thins its wall | Flash vessels, knock-out drums, pressure vessels, pipelines |
| Bulging | How far a shell has permanently deformed, and how close that has taken the material to its limit | Coke drums |
| Ovality | How far each cross-section of a shell is out of round | Coke drums |
| Crack | Whether a crack-like flaw stays acceptable as it grows, and for how long | Coke drums |
A result is calculated, not observed. It reports what the structural twin shows at each assessed location from the data supplied, and it is read alongside inspection findings rather than in place of them.
3. How Does a Result Reach Your Dashboard Report?
Every assessment passes through the same three stages, whatever the asset: data, calculation and results. Figure 1 shows the three stages and the Akselos platform that carries each one.

Figure 1. The engineering overview, from the data of an asset to its Dashboard Report
- Data. Drawings and design data describe the asset as built, while sensor data and inspection reports describe it as it is. Preprocessing tools turn the drawings into the geometry and mesh of the model. Table 2 lists what each kind of data feeds.
- Calculation. Akselos engineers build the as-built structural twin, a high-fidelity finite element model of the asset, from its drawings and design data. The loads from the sensor data and the condition measured by inspection turn it into the as-is structural twin, the model of the asset as it operates. The Akselos Cloud Solver then assesses each damage mechanism on the as-is structural twin, each time new operating data is processed.
- Results. The results are published to a Dashboard Report on the Akselos Portal, which opens in a web browser with nothing to install.
Table 2. The three kinds of input data and what each one feeds
| Input | What it is | What it feeds |
|---|---|---|
| Drawings and design data | Drawings, geometry, materials and design conditions | The as-built structural twin |
| Sensor data | Readings recorded while the asset runs, such as temperature and pressure | The loads on the as-is structural twin, for every assessment |
| Inspection reports | Measurements taken during inspection, such as a laser scan of a vessel’s inner wall or a recorded crack | The measured condition of the as-is structural twin, for the assessments that start from it |
Info: How organizations, collections and reports are arranged on the Akselos Portal is covered in Akselos Portal First Look. Who can open a Dashboard Report is covered in Understand Your Access Levels.
4. How Do You Read a Dashboard Report?
A Dashboard Report is read from the whole asset, down to one location, and back through time. Figure 2 shows all three levels on one page of the Coker Dashboard.
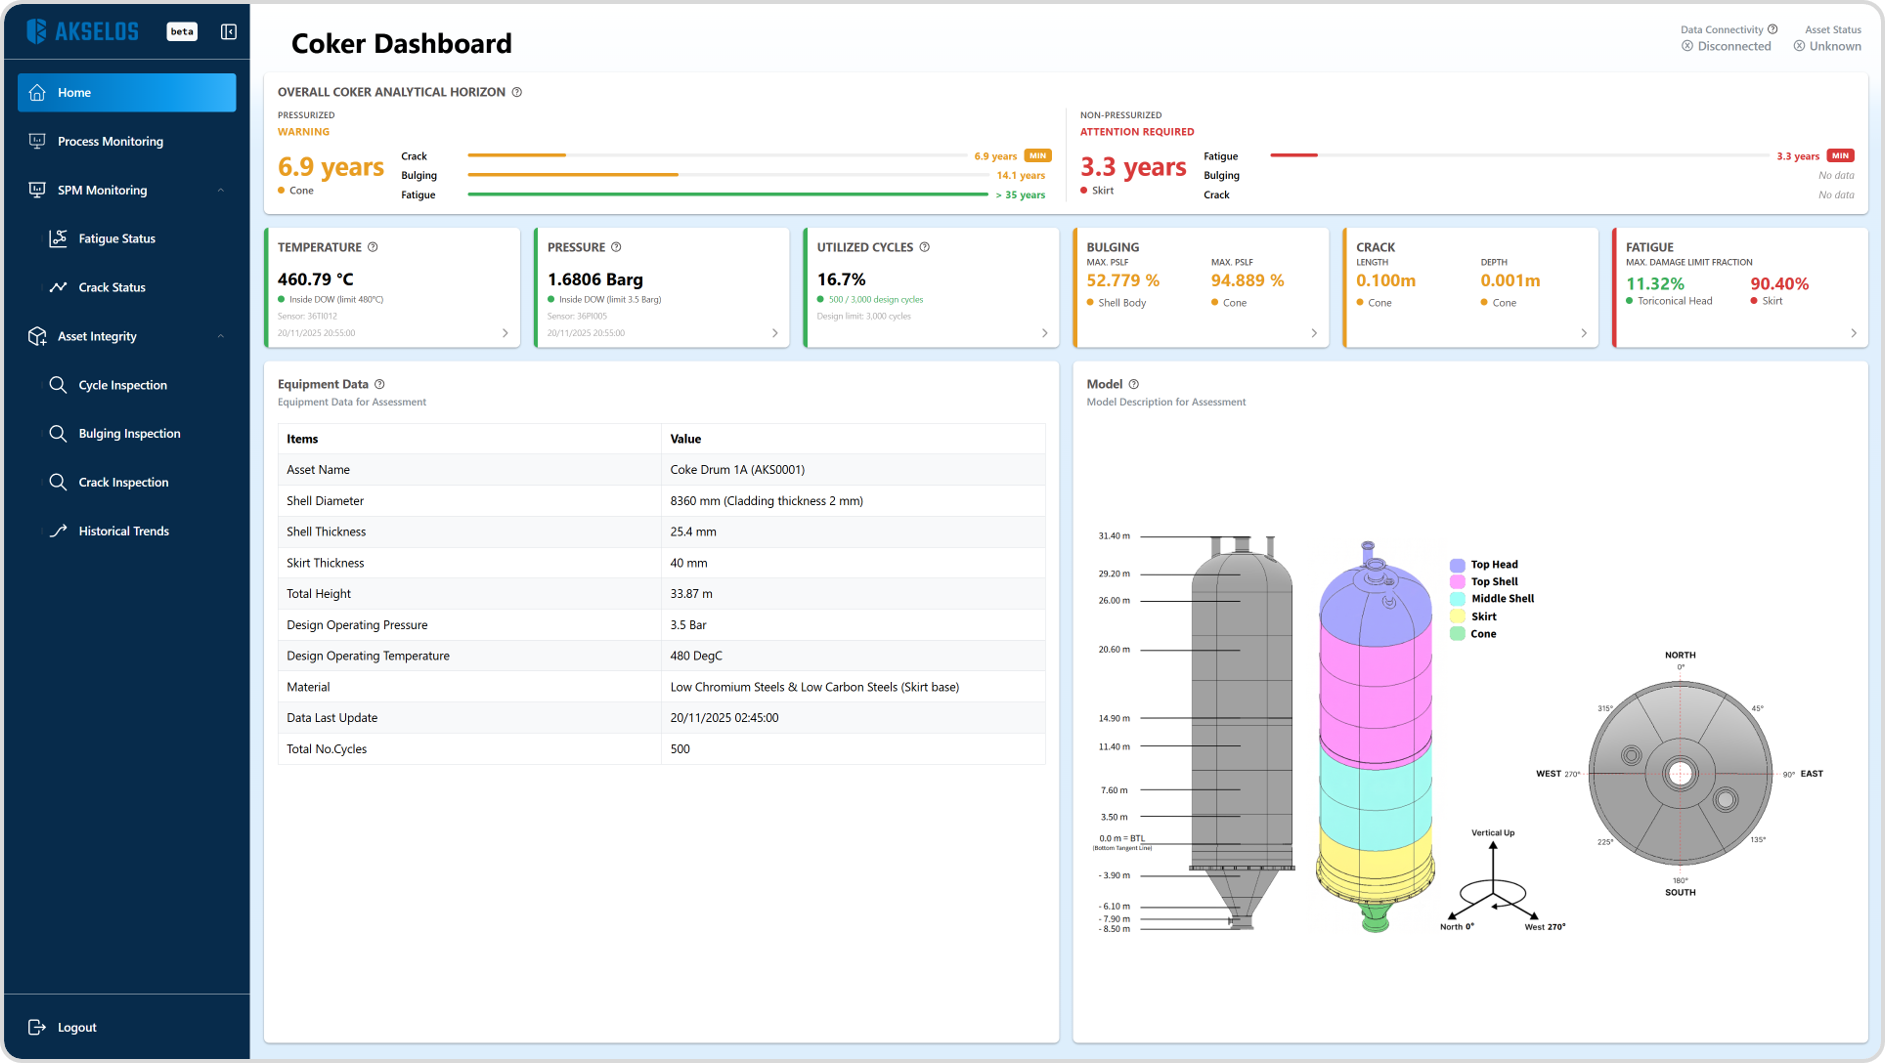
Figure 2. Fatigue Status on the Coker Dashboard, an example of a Dashboard Report
- The whole asset: summary values, such as the highest result and the location where it occurs.
- Where on the asset: the result at each assessed location, ranked in a table or drawn on the model, so the locations that matter most stand out.
- How it got there: the history of the result over time, with the operating data behind it.
The highest value in a summary belongs to one location, the worst assessed one. It is not an average over the asset.
Page names and layouts differ from one report to the next, and each product’s user manual names the pages and explains every chart.
Tip: Sample collections and Dashboard Reports are available in the CustomerTrainingLIB organization on the Akselos Portal. To get access, contact Akselos Support at [email protected].
5. How Do Assessments Work on Real Assets?
The examples below follow the same chain on three refinery assets, each with its own damage mechanism and its own Dashboard Report. For each one, they cover the asset and its unit, what makes it demanding to operate, how SPM assesses it, and where the results appear. Every asset in Table 1 follows the same pattern.
Coke Drum: Fatigue, Bulging, Ovality and Crack
A coke drum is the vessel in a delayed coking unit where the coke forms. A unit runs at least two drums, and each drum repeats the same cycle: it is filled with hot feed, the coke forms, the drum is quenched with water, and the coke is cut out.
Every cycle loads the shell thermally, and the load changes from cycle to cycle, because cycle times, heating rates and cooling rates vary. During the quench, the water channels unevenly through the coke bed, so one side of the shell cools faster than the other, as Figure 3 shows. Over many cycles this loading uses fatigue life, deforms the shell permanently into bulges, pushes its cross-sections out of round, and can grow cracks.
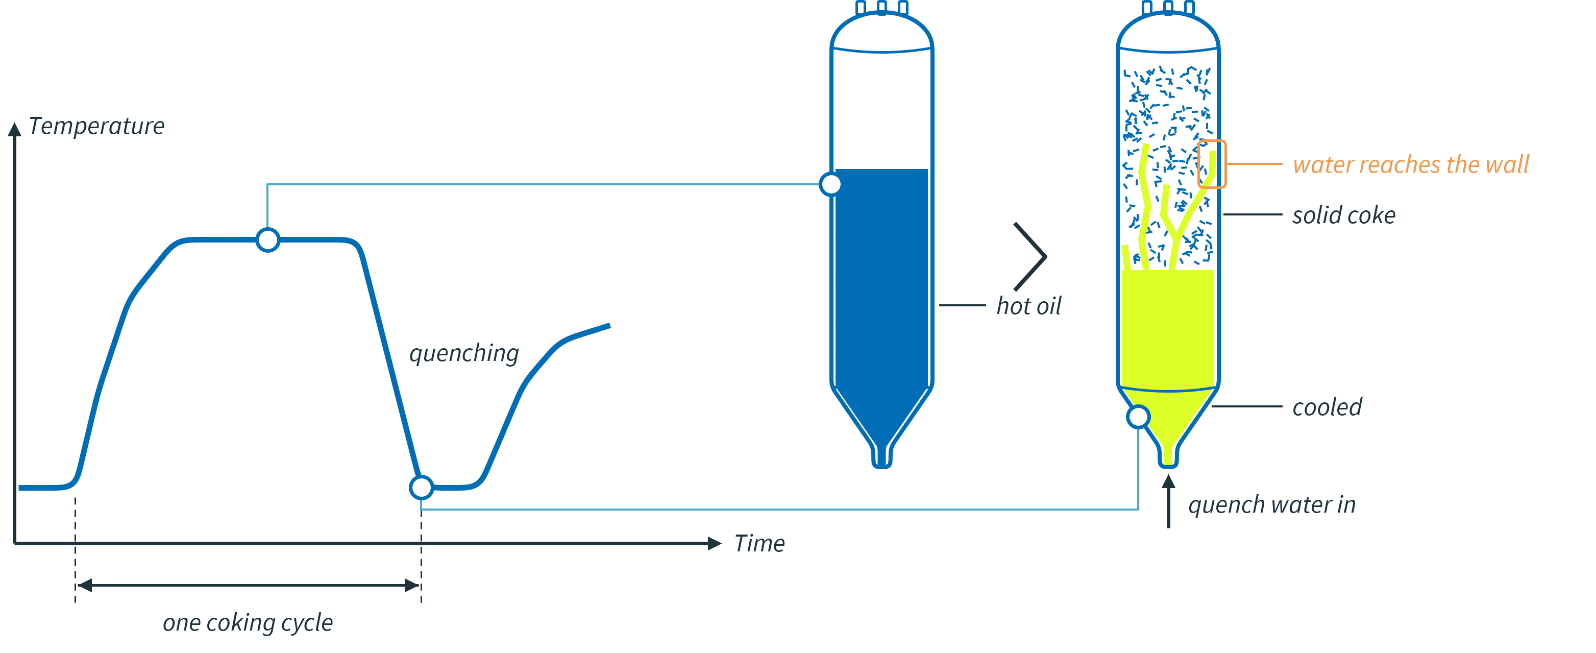
Figure 3. One coking cycle, with the drum at the coking plateau and during the quench
SPM for Cokers is the Akselos SPM system for delayed coking units. It assesses fatigue, bulging and crack, following API 579-1/ASME FFS-1, and it checks ovality as a separate assessment. Figure 4 shows how the operating data, the laser scans and the inspected cracks reach the four assessments and the Coker Dashboard.
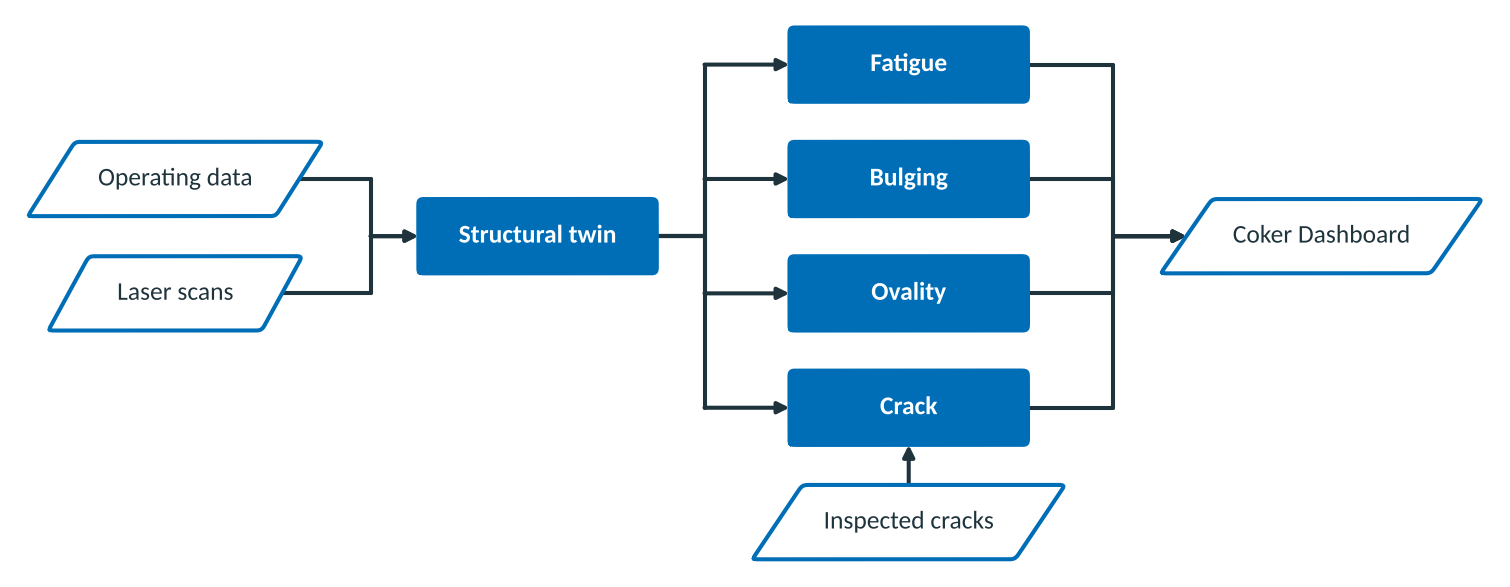
Figure 4. The coke drum assessments, from the plant data to the Coker Dashboard
Each assessment answers its own question:
- Fatigue adds up the fatigue life used at each assessed location, cycle by cycle, from the temperature, pressure and liquid level that the plant instruments record.
- Bulging uses the laser scans of the inner wall taken at each turnaround to report how far the shell has permanently deformed, and how close that has taken the material to its limit.
- Ovality uses the same laser scans to check how far each cross-section of the shell is out of round, against the out-of-roundness limit of ASME BPVC Section VIII Division 1, paragraph UG-80.
- Crack checks whether each tracked flaw is acceptable, and for how long it stays acceptable as it grows.
Every cycle uses a share of drum life. SPM for Cokers uses Physics AI to show how much each cycle uses, so operations can optimize cycle by cycle. Structural integrity engineers read the same results as an input to turnaround planning and to the scope of each inspection campaign.
The results appear in the Coker Dashboard. Fatigue Status, shown in Figure 2, reports how much fatigue life the drum has used and which locations are using it fastest. Bulging and ovality are read on Bulging Inspection, and crack on Crack Status. Every page is explained in the SPM for Cokers user manual, What Your Coke Drum Is Telling You.
Reactor: Minimum Pressurization Temperature
A hydrocracking unit converts heavy hydrocarbon feedstocks into lighter, high-value products such as gasoline, diesel and jet fuel. Its reactors are heavy-walled vessels, and their steel is exposed to hydrogen in service. The demanding phases are startup and shutdown, which can take several days. Through them the steel carries thermal stress, while hydrogen embrittlement and temper embrittlement reduce its ductility and toughness and raise the risk of brittle fracture.
The minimum pressurization temperature, written MPT, is the lowest temperature at which the reactor can be safely pressurized. Figure 5 shows why it matters. In service, hydrogen from the process enters the steel wall as atoms (H) and gathers as molecules (H₂) in small flaws. Below the MPT, the steel is not tough enough to carry the full pressure, so each heat-up brings the wall to the MPT before the reactor is pressurized.
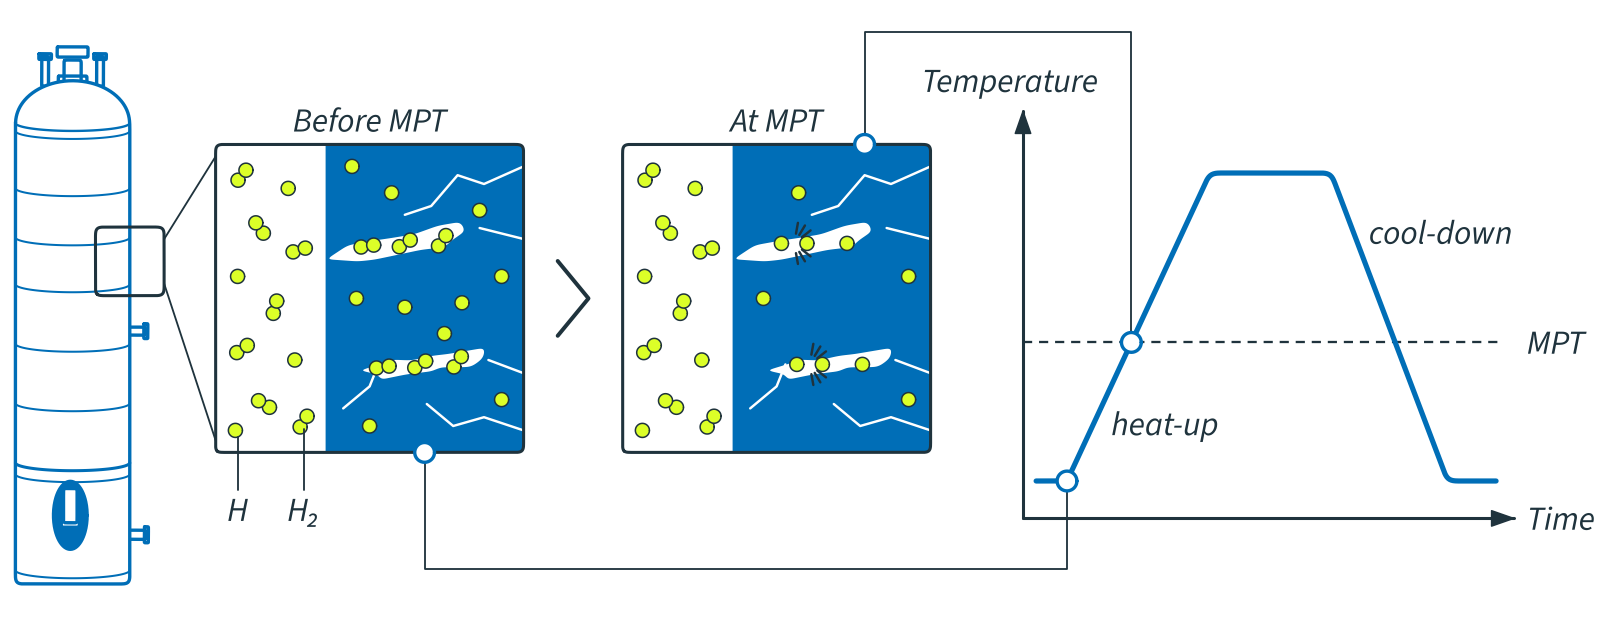
Figure 5. Hydrogen in the reactor wall before the MPT and at the MPT, on one heat-up and cool-down
Traditional MPT curves are often conservative, which slows heat-up and cool-down and adds downtime. SPM for Reactors calculates the stress at critical locations, such as nozzles and welds, and compares it with the MPT curve set for each material zone. Figure 6 shows the chain, from the temperature and pressure sensors on the reactor to the MPT Dashboard: the recorded readings drive a heat model, its temperature field drives a stress model, and the stress at each zone is checked against its MPT curve.

Figure 6. The MPT assessment, from the sensors on the reactor to the MPT Dashboard
The result is the Utilization Factor: the ratio of the calculated maximum principal stress to the allowable stress at the current temperature. A value of 1.0 means the calculated stress has reached the allowable stress. The MPT - What-If Analyzer applet runs the same assessment on a user-defined heat-up or pressurization profile, without affecting the live results. The same reactor can also be assessed for fatigue.
The results appear in the MPT Dashboard. MPT Monitoring, under SPM Monitoring, reports the highest Utilization Factor, where it occurs, and the MPT curve of that location, as Figure 7 shows.
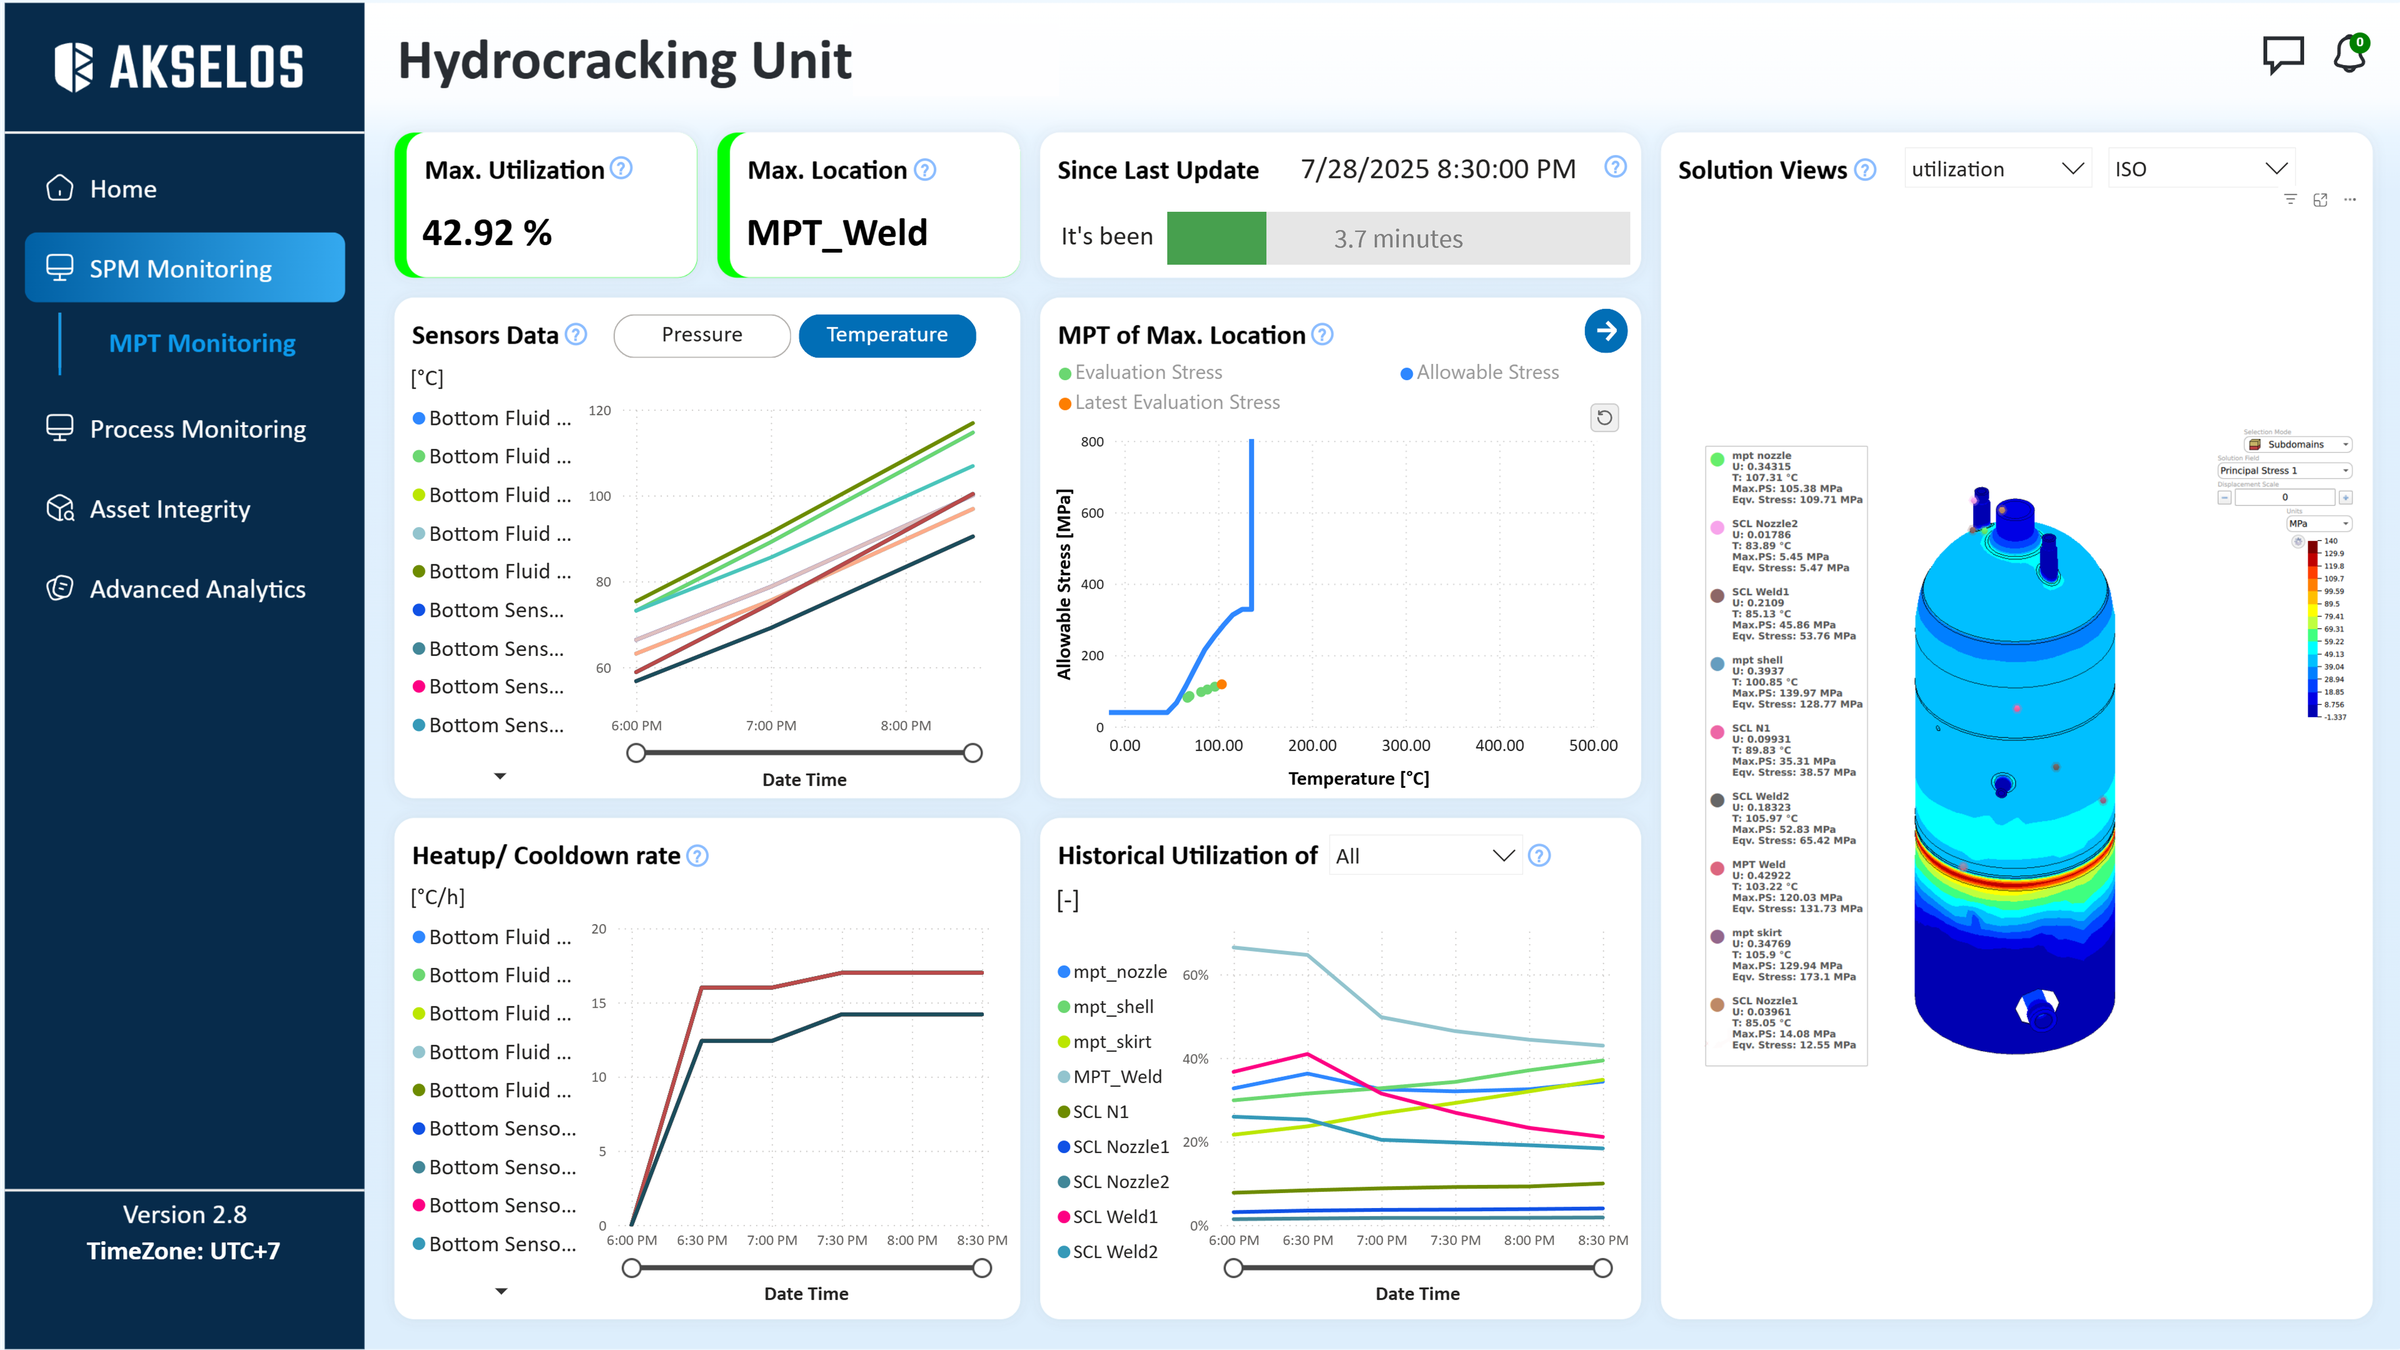
Figure 7. MPT Monitoring, the main page of the MPT Dashboard
Process Monitoring, Asset Integrity and Advanced Analytics add the sensor history, the results for every zone and the what-if results. Every page is explained in the SPM for Reactors user manual, Part 2: Reactors MPT Dashboard.
Steam Methane Reformer: Creep
A steam methane reformer is the core operating unit of most large-scale hydrogen production facilities. Steam is mixed with natural gas and heated in catalyst-filled tubes inside a furnace, where the methane is partly converted into hydrogen, carbon dioxide and carbon monoxide. Outlet pigtails carry the reformed gas from each tube to the outlet collector, and they take up the thermal expansion of the system. Figure 8 shows the structural twin of an outlet system, with the main header, the sub-headers and the pigtail array.
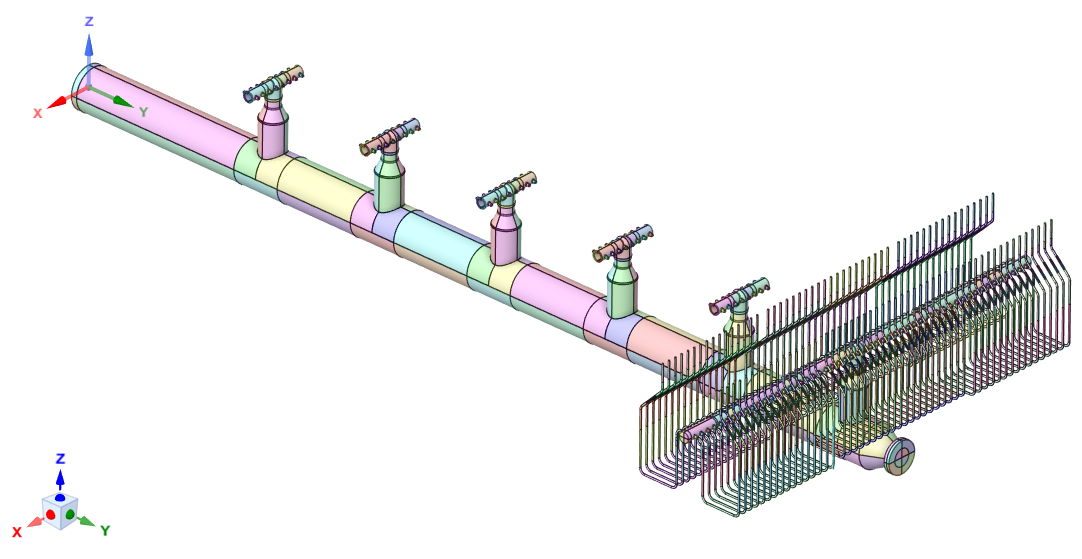
Figure 8. The structural twin of a steam methane reformer outlet system
The outlet system runs at high temperature under sustained pressure for long periods, and under those conditions steel deforms slowly and permanently. That deformation is creep, and failure of the outlet pigtails is a common cause of plant downtime and a risk to personnel. Outlet pigtails can operate at temperatures up to 900°C, and they are designed on the basis of creep rupture.
Akselos assesses creep on the outlet system following the creep procedure of API 579-1/ASME FFS-1 Part 10. The structural twin carries the temperature, the internal pressure, the self weight, the counterweight load and the load from the tube hangers. Creep damage is calculated step by step through the operating history and accumulated for each pigtail, and a total of 1.0, or 100%, marks the end of the creep life the assessment allows. The result shows where creep concentrates on each pigtail, such as at the weld, the bend and the hanger, and estimates the creep life left before the damage reaches 100%. Figure 9 shows the steps.
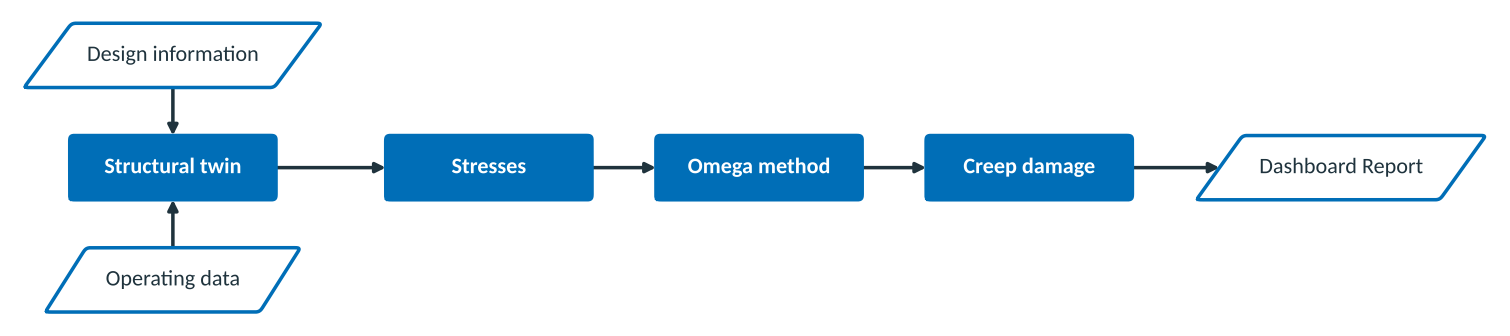
Figure 9. The creep assessment, from the structural twin to the Dashboard Report
The results appear in a Dashboard Report at three levels: the whole outlet system, each unit, and each pigtail, with its accumulated creep damage over time. Figure 10 shows the level of one pigtail.
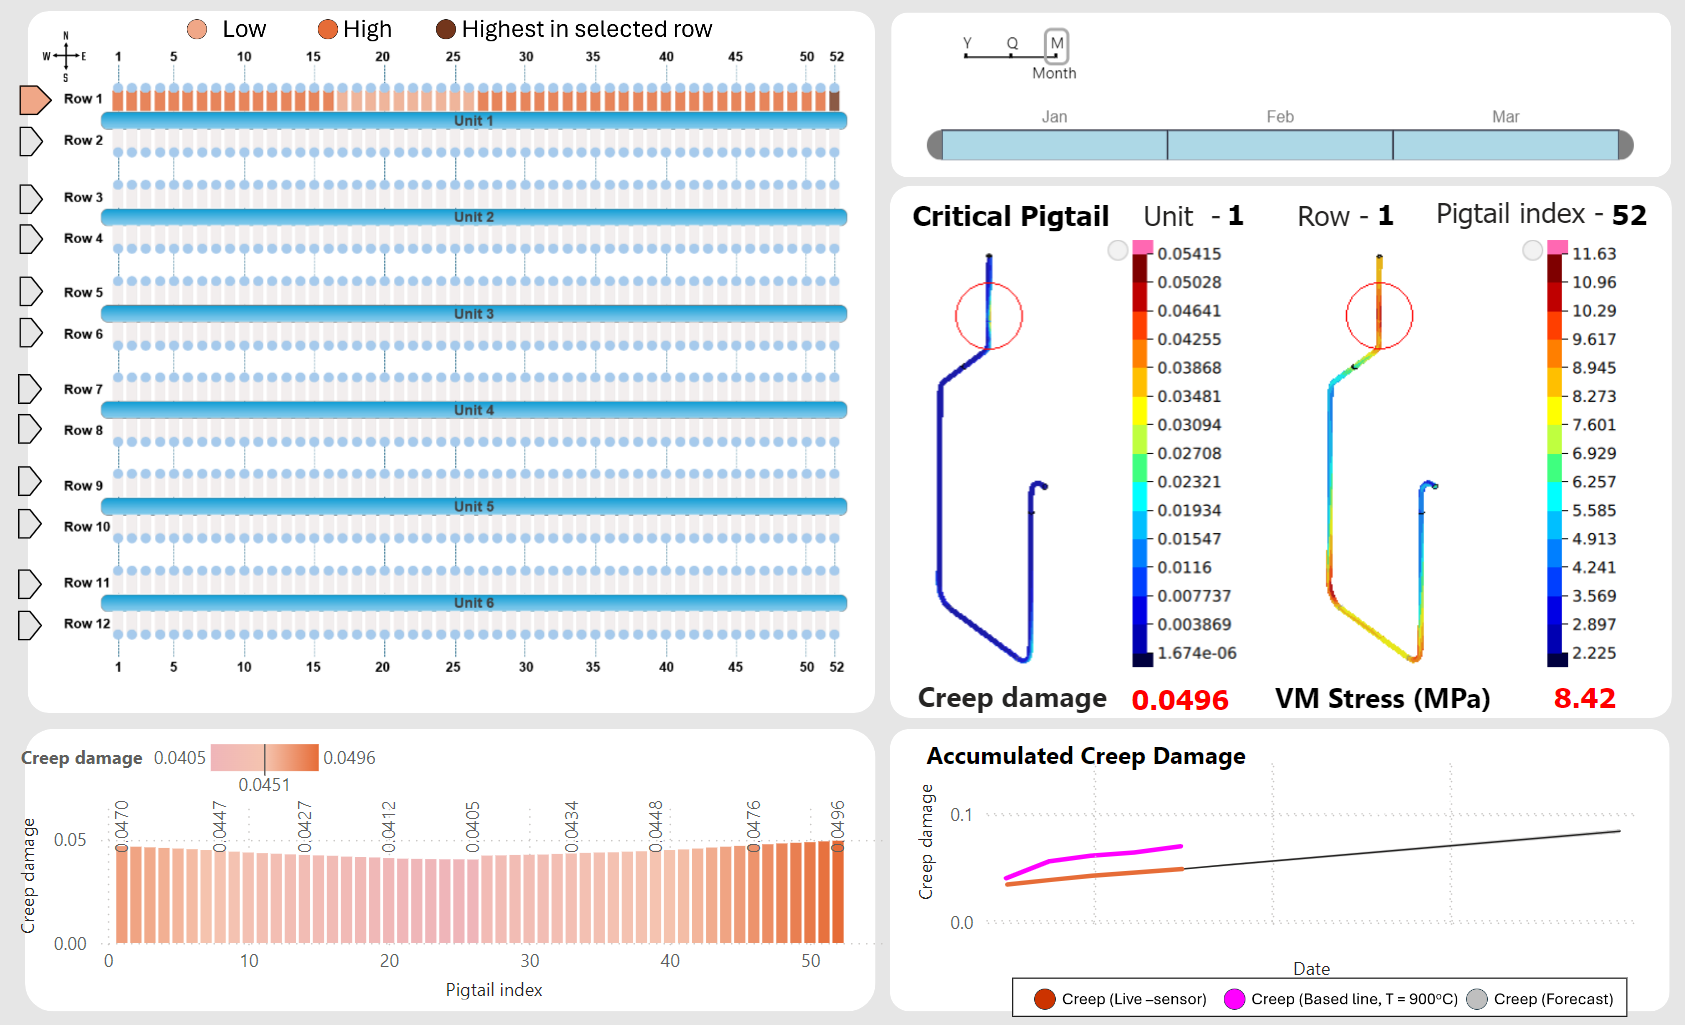
Figure 10. Accumulated creep damage for one outlet pigtail on a creep Dashboard Report
To discuss a creep assessment for a steam methane reformer, contact Akselos Support at [email protected].