1. Introduction
This tutorial follows two fatigue use cases on the Coker Dashboard, page by page. Each one starts from a table on Fatigue Status, ends on Cycle Inspection, and stands on its own.
Table 1 lists the two use cases, the question each one answers and the pages it crosses.
Table 1. The two fatigue use cases and the pages they cross
| Section | The question it answers | Pages |
|---|---|---|
| 3. Inspecting One of the Worst Cycles | Did a handful of severe cycles do most of the fatigue damage? | Fatigue Status, Cycle Inspection, Home, Process Monitoring |
| 4. Finding Short Cycles with Low Damage | Can the drum run shorter cycles that each use only a small share of drum life? | Fatigue Status, Historical Trends, Cycle Inspection |
Info: The figures show a demonstration asset. Zone names, elevations, sensor tags and every value are set when the structural twin is built for a given drum, so each asset shows its own.
2. Who This Is For
This tutorial suits engineers with an interest in the structural integrity of a coke drum, in particular those who follow the fatigue, bulging and crack results on the Coker Dashboard, and their trends, as an input to turnaround planning and inspection scope. Each use case takes the whole operating record of a drum down to the few cycles worth discussing, using two or three pages already on the dashboard.
The steps assume access to the Coker Dashboard for the asset. Without it, contact Akselos support at [email protected].
3. Inspecting One of the Worst Cycles
Is the fatigue damage on this drum spread across ordinary operation, or did a handful of severe cycles do most of it?
The answer lies in the share of drum life each cycle uses on its own, and the dashboard reports it in three places that build on each other. Top 10 Worst Cycles ranks every recorded cycle by the damage it caused on its own and names the worst ones. Per-Cycle Damage Statistics places one of them among the cycles around it and against the average. Cycle Inspection then opens that cycle to show where on the drum it did its damage and what the sensors recorded while it ran.
To find the cycles that did the most damage and see what happened during one of them, follow these steps:
- In the navigation panel, expand SPM Monitoring and select Fatigue Status. The page holds the fatigue record for the whole drum, and the next two steps both start here.
- Scroll down to Top 10 Worst Cycles and choose a cycle of interest, for example the most recent one in the list. The table ranks every cycle in the full recorded history by Maximum Per-Cycle Damage [%], highest first (Figure 1). Note the Cycle ID and Start Date of the chosen cycle, which locate it in the next step.
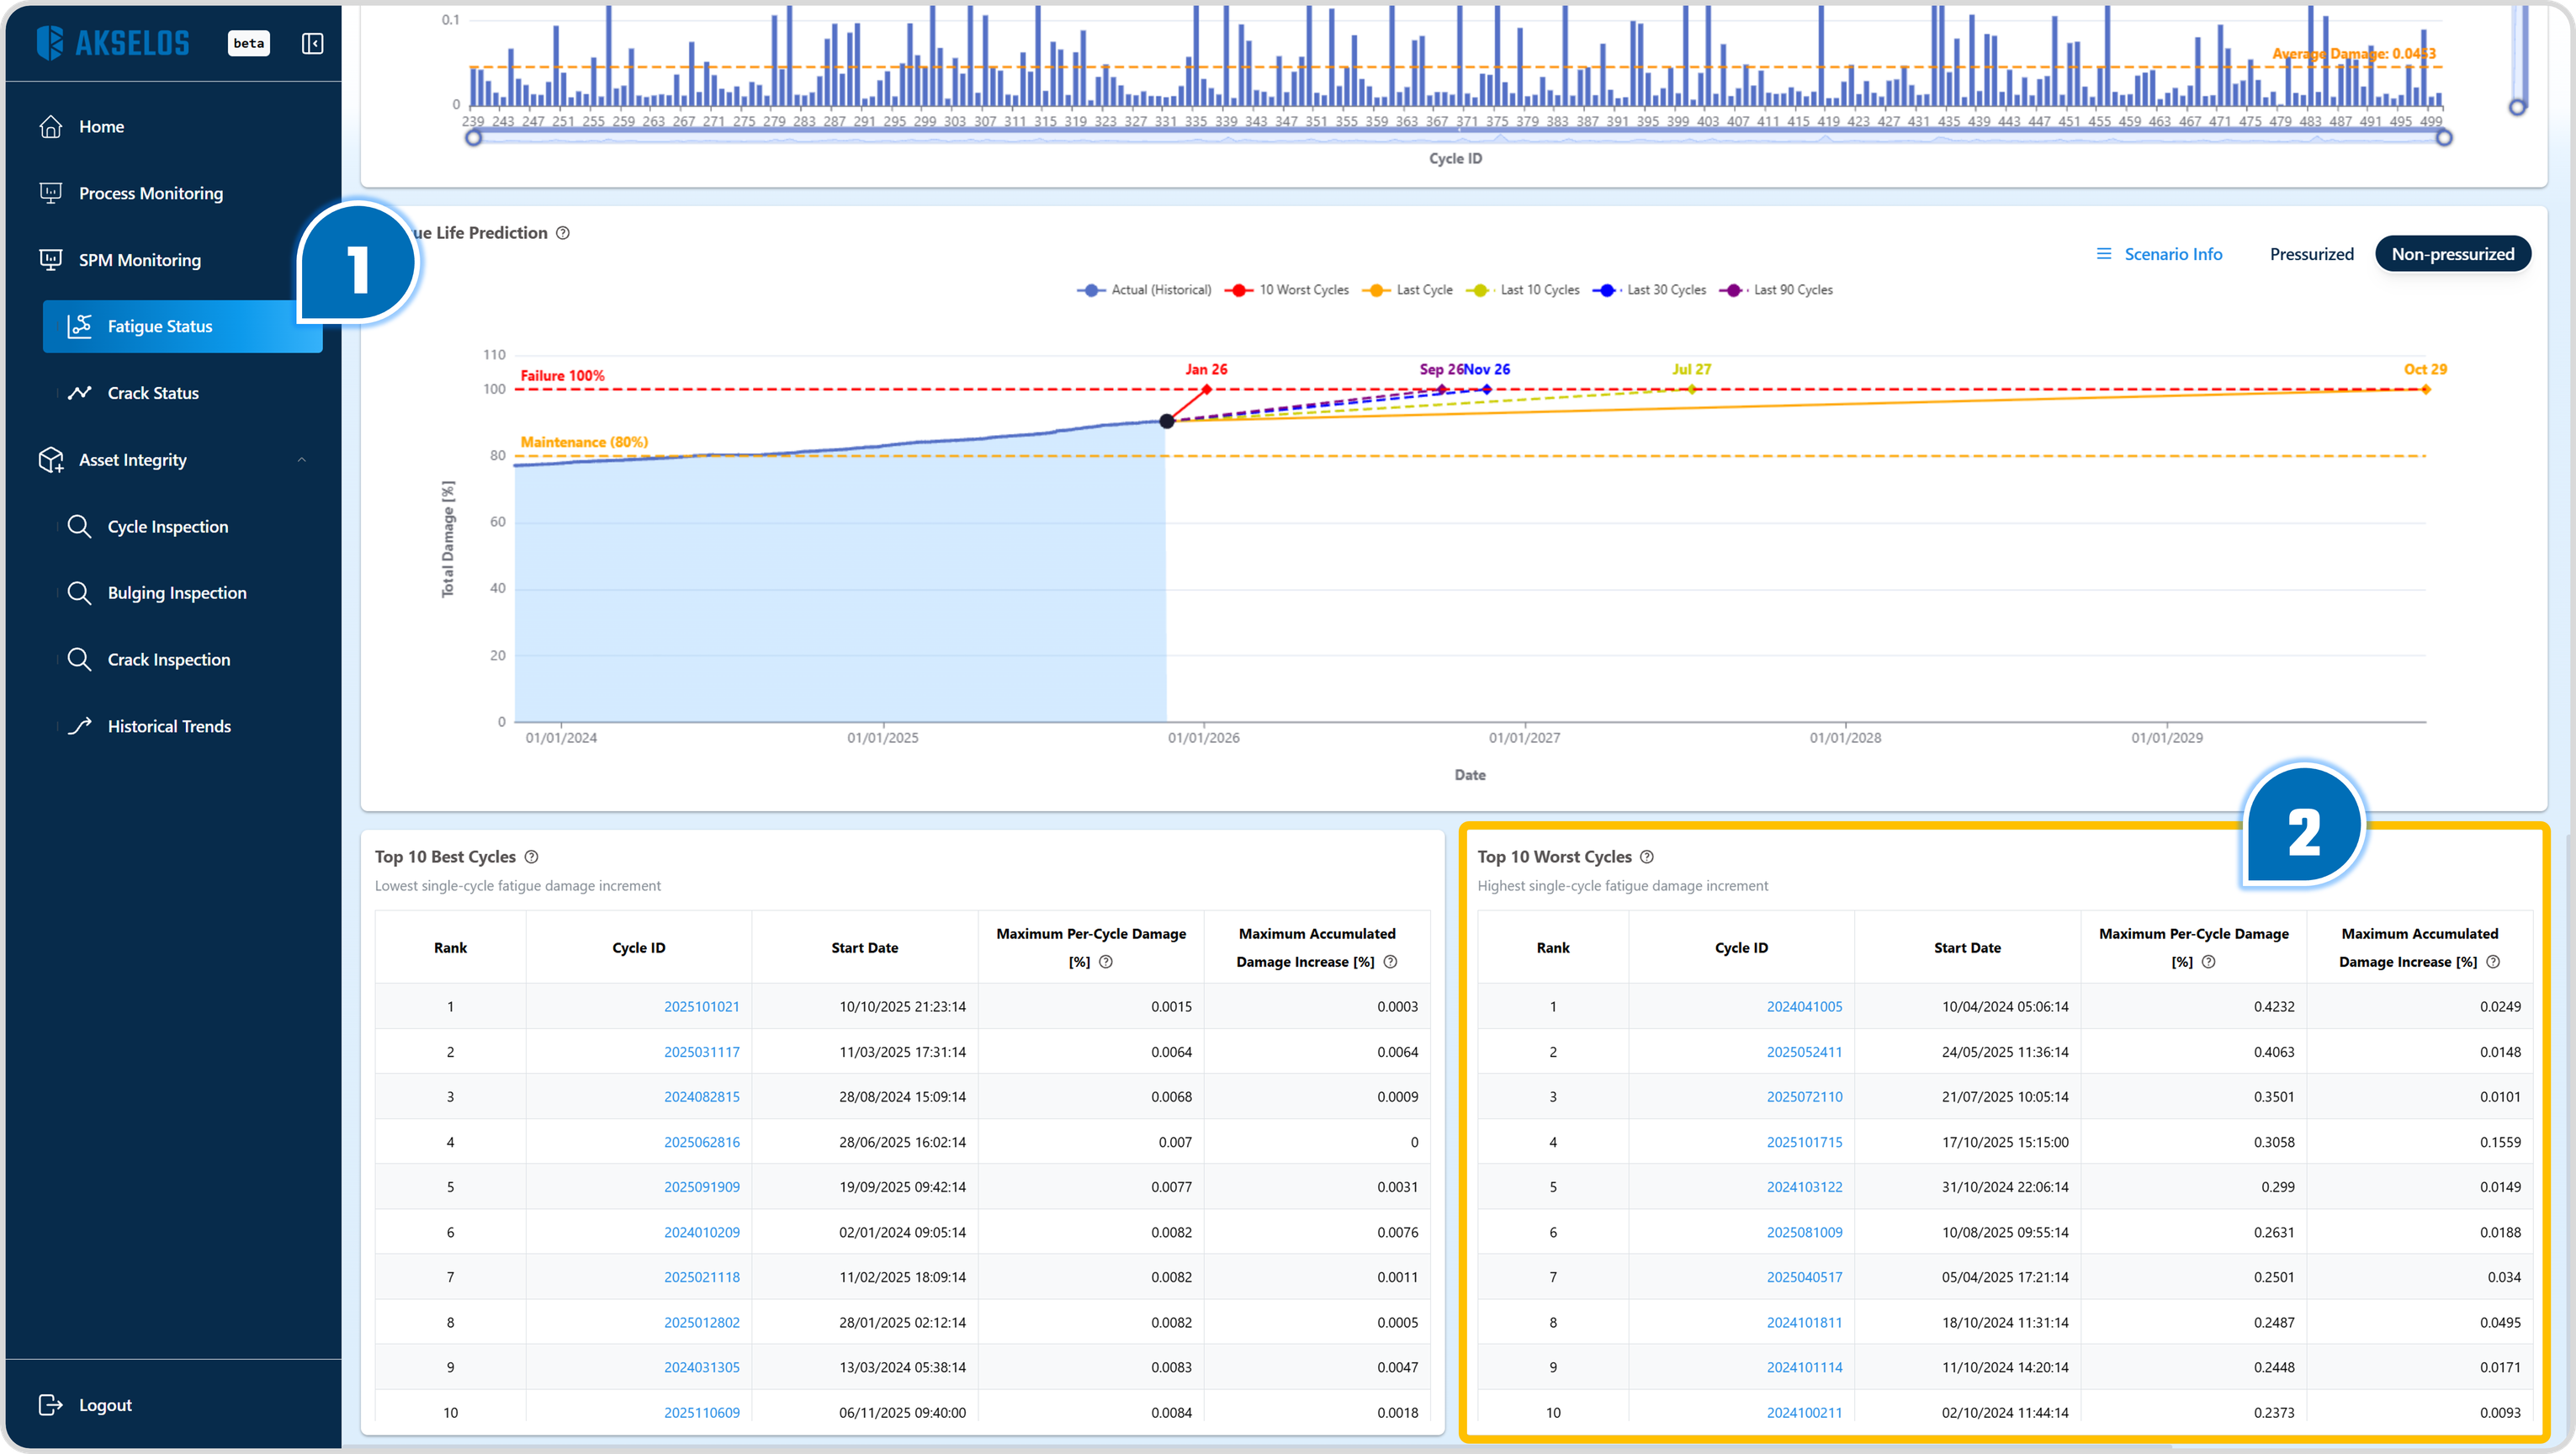
Figure 1. Top 10 Worst Cycles, ranked across the full recorded history
Idea: Each row reports two damage figures. Maximum Per-Cycle Damage [%] is the peak damage the cycle produced at any model location. Maximum Accumulated Damage Increase [%] is how much the cycle raised the peak cumulative damage on the model, from the previous cycle to this one. The two differ when the cycle hits hardest at a location other than the one carrying the highest cumulative damage.
- Scroll up to Per-Cycle Damage Statistics to see that cycle in context. Set Granularity to Cycles, enter a window around the noted Start Date in From and To, and select Apply. Hover the bars to find the cycle whose Start date matches the noted date. This chart labels each cycle by its sequence number, so the date is what links the bar to the table row (Figure 2). The orange Average Damage line and the neighboring bars show whether the cycle stands alone or sits among other high-damage cycles.
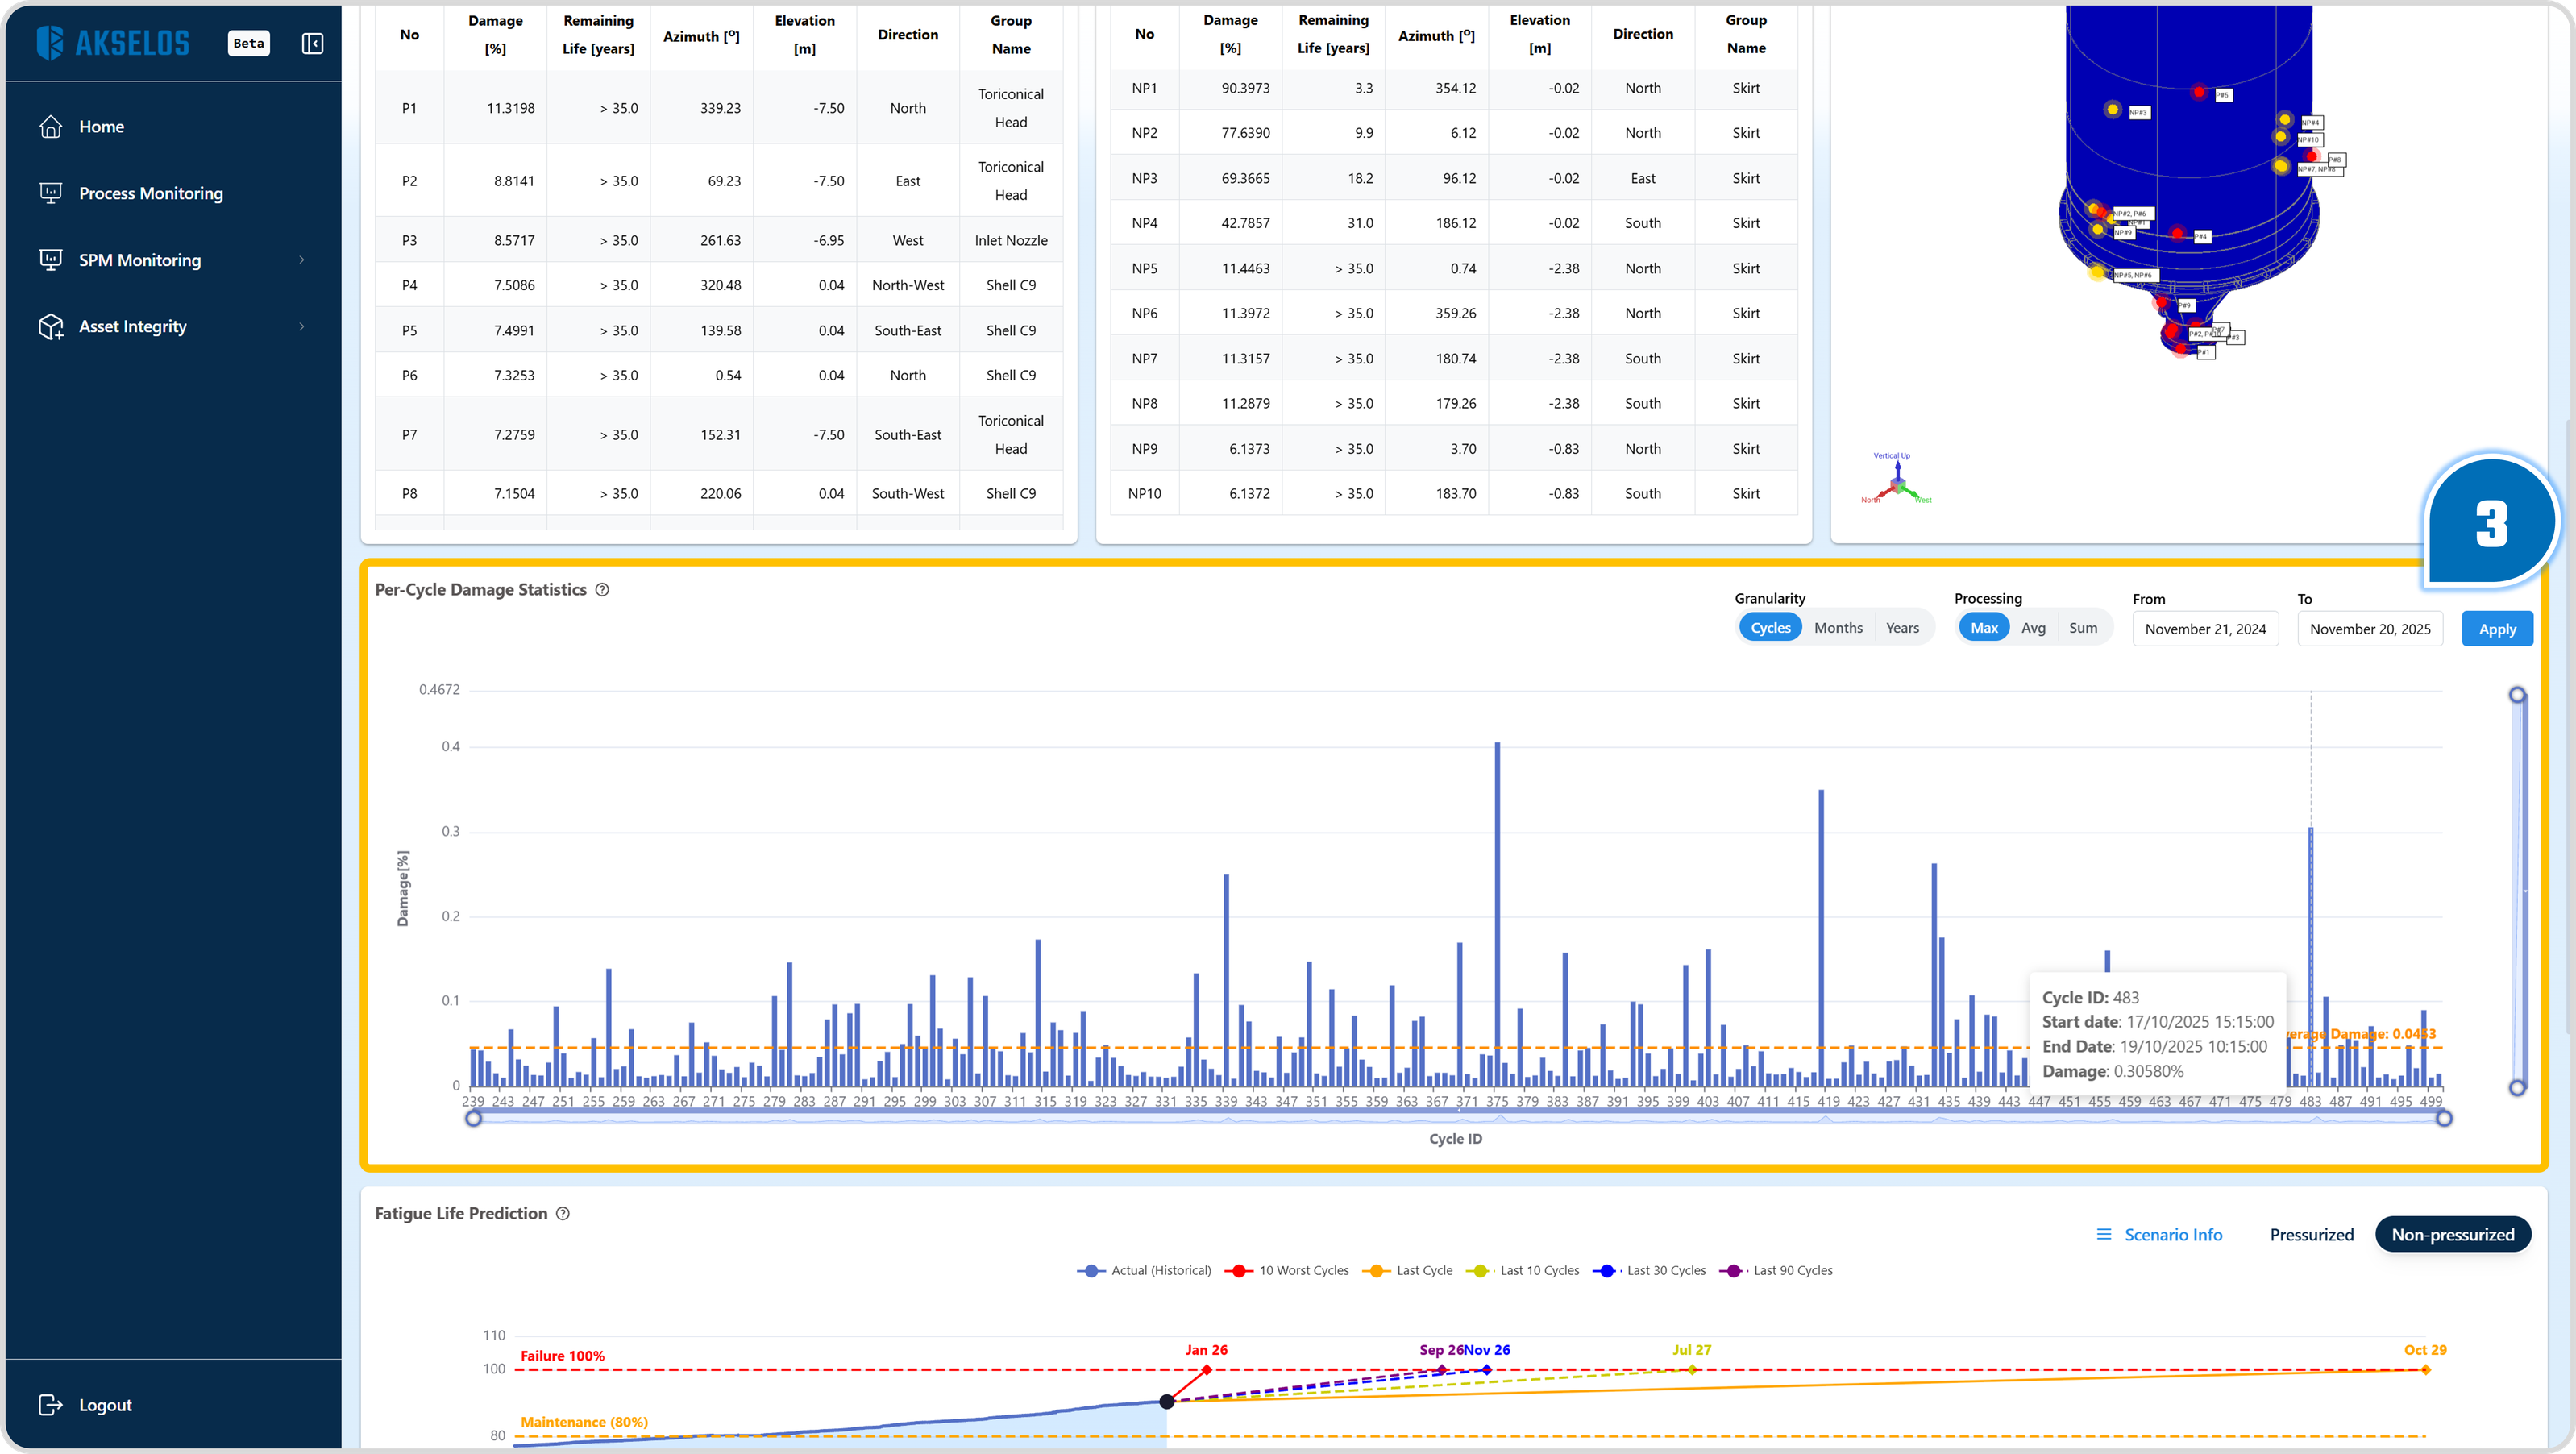
Figure 2. Per-Cycle Damage Statistics, with the selected cycle against the Average Damage line
- Double-click the cycle’s bar, or select its Cycle ID in Top 10 Worst Cycles, to open it on Cycle Inspection (Figure 3). This page reports that one cycle alone, from what the plant measured to what the structural model computed.
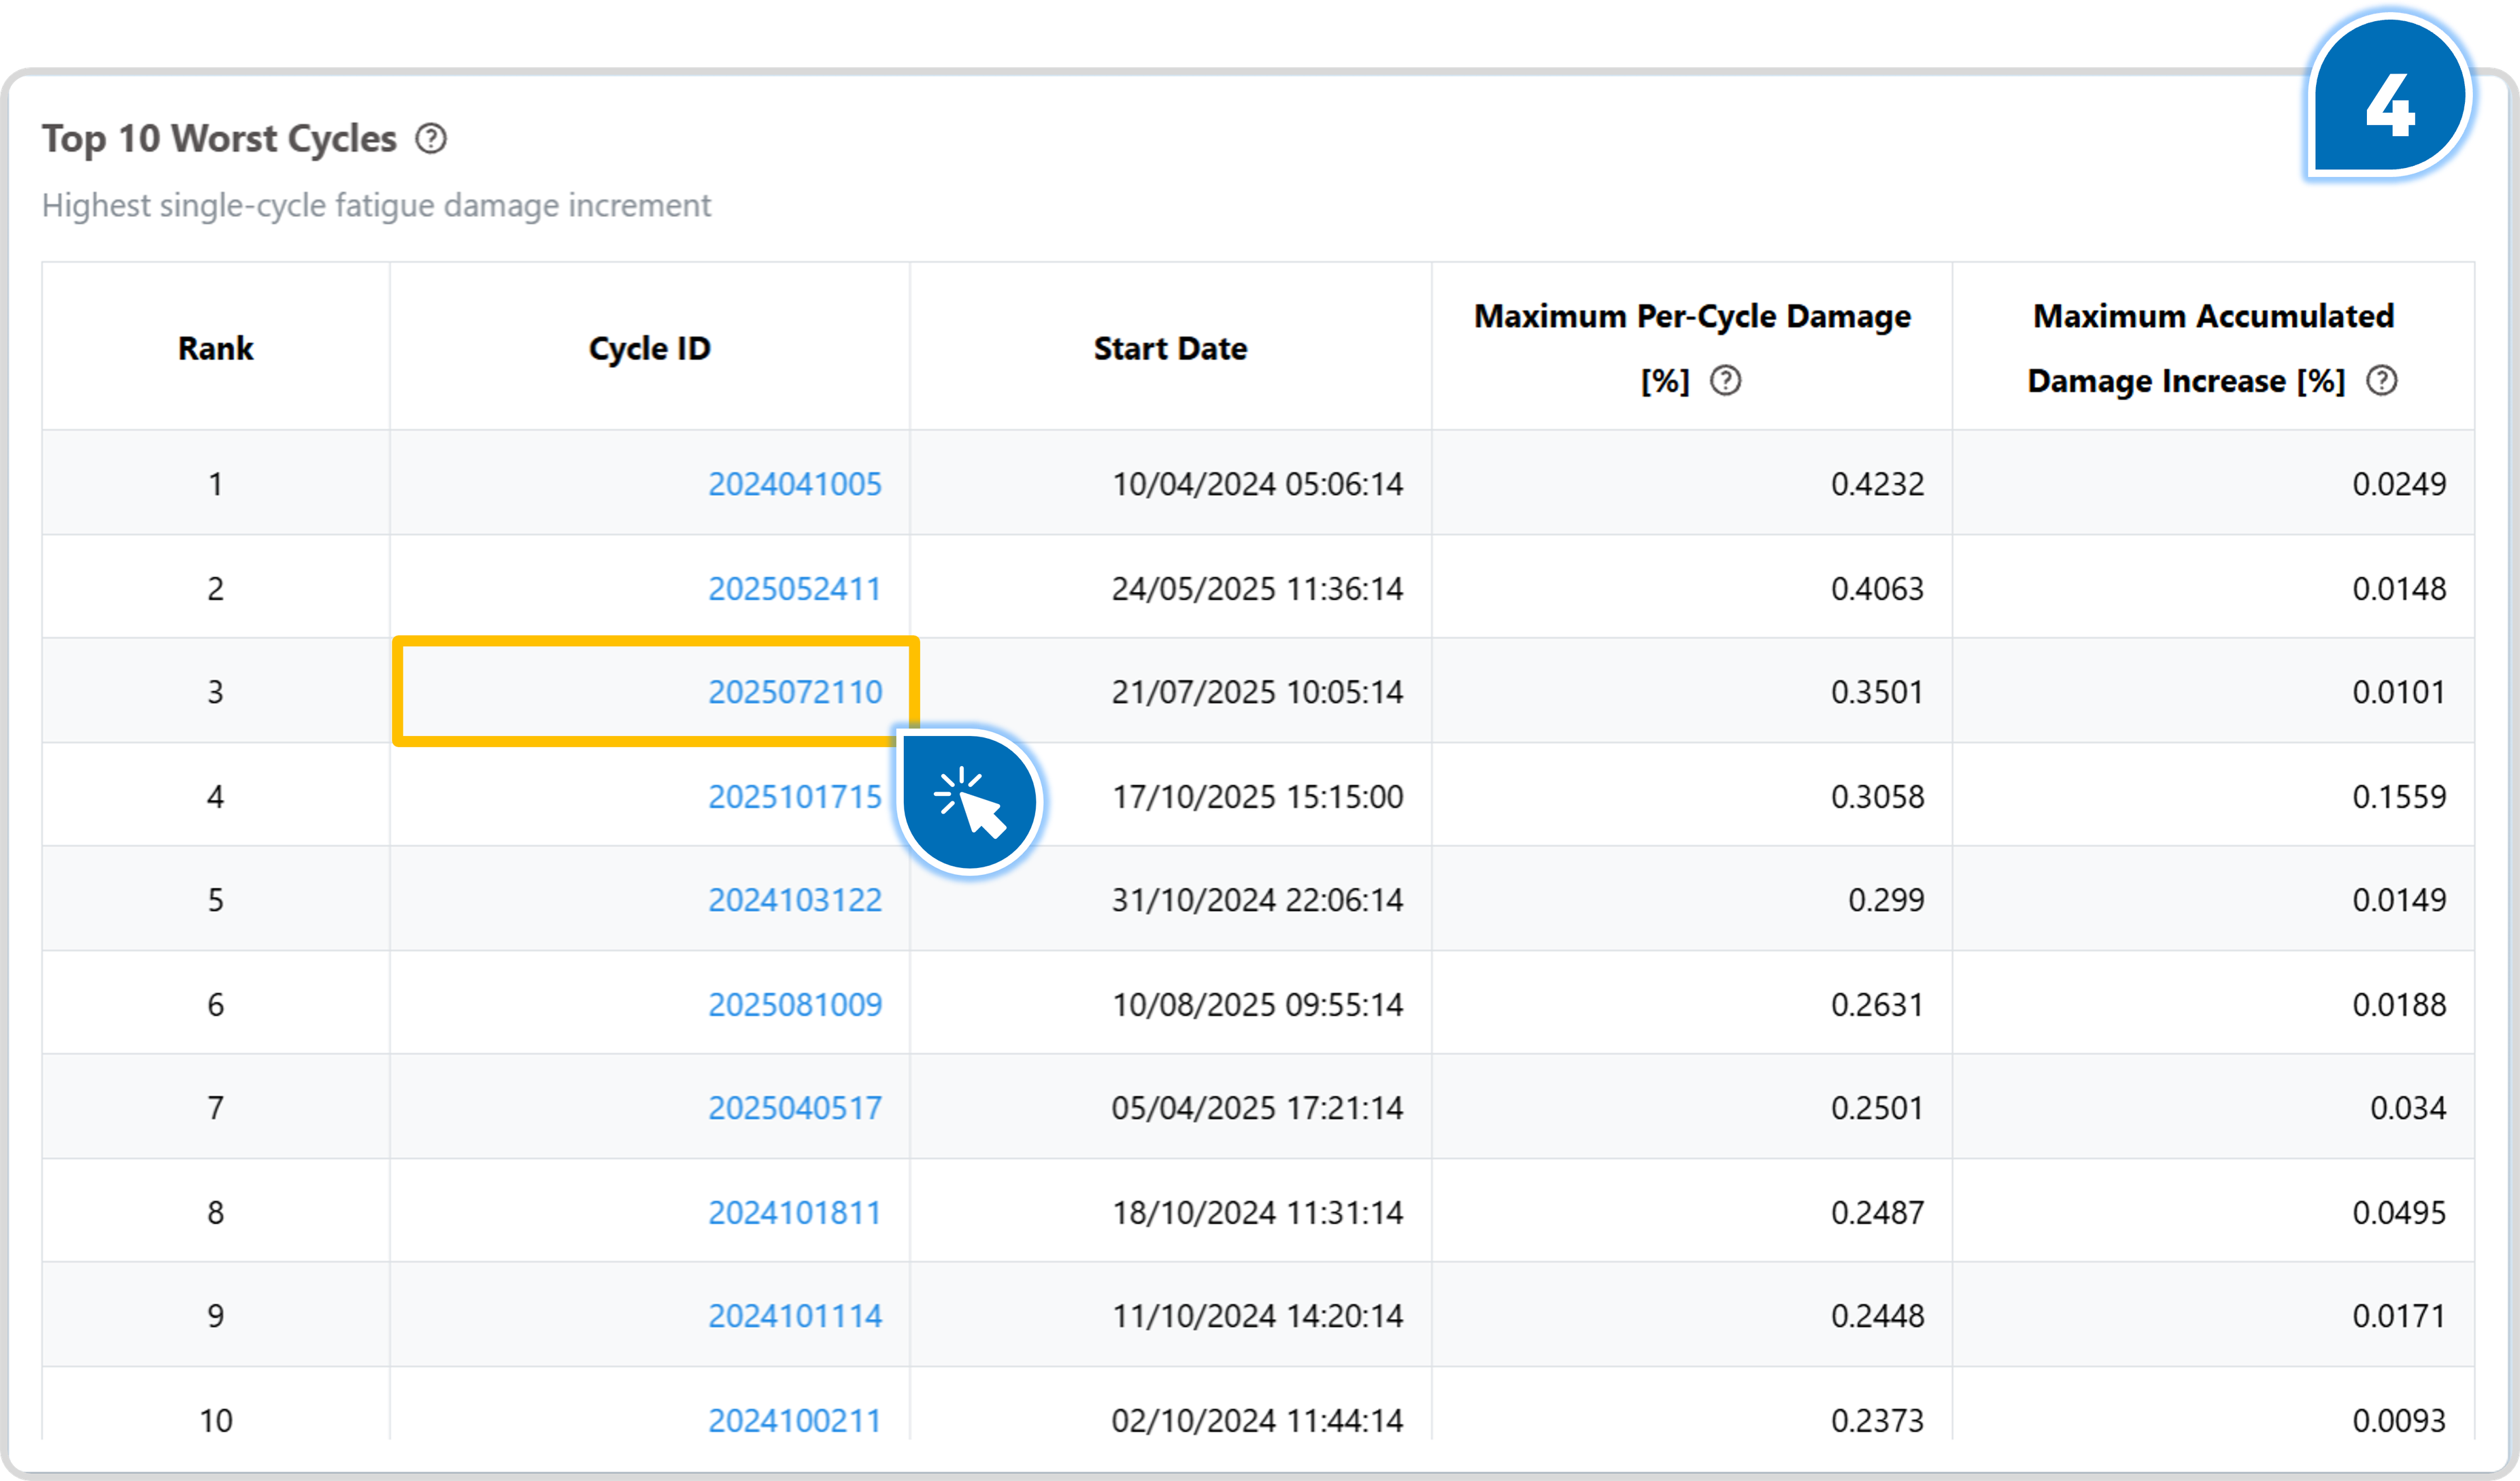
Figure 3. Selecting a Cycle ID in Top 10 Worst Cycles to open the cycle on Cycle Inspection
- Start with where the damage went. On Total Single Fatigue Damage by Elevations, switch between Pressurized and Non-pressurized and choose the bar of interest. The chart reports the damage this cycle did at each elevation, which ties the cycle to a place on the drum.
- Place that elevation on the drum and find the thermocouples there. The Model panel on Home marks the elevations of the drum from its datum, and Sensor’s Location on Process Monitoring places every instrument tag on the same vessel. Note the temperature tags installed at that position (Figure 4).
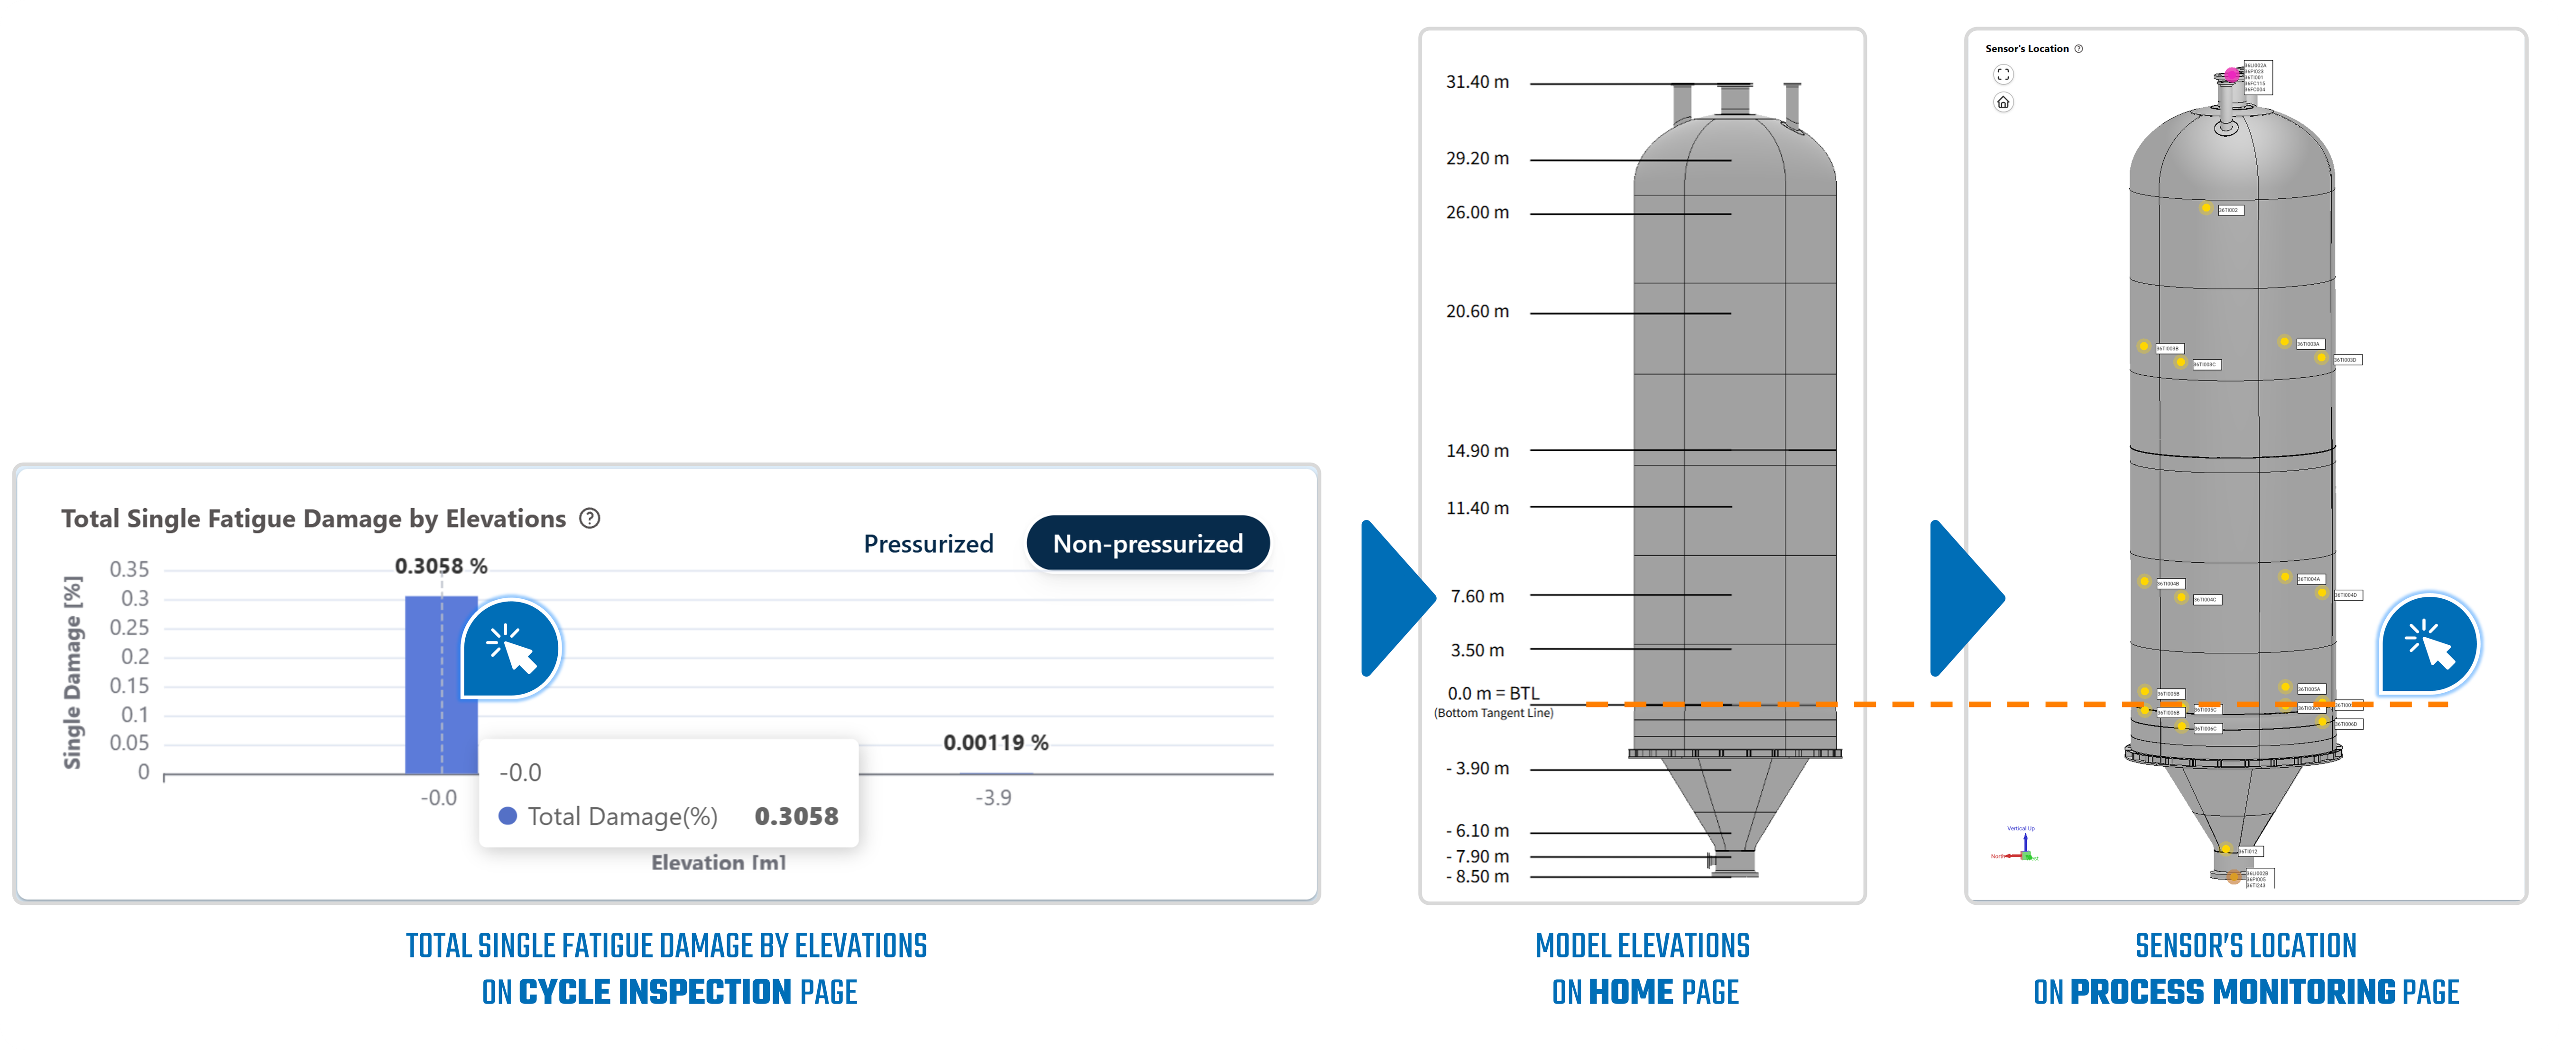
Figure 4. Tracing a damaged elevation to the sensors installed there
- Return to Cycle Inspection and confirm the cycle in Cycle Selection. In Sensor Data of Cycle, choose temperature, then in Sensors Selection select None and tick only the noted tags. The traces show the temperatures recorded at the chosen elevation through the cycle (Figure 5).
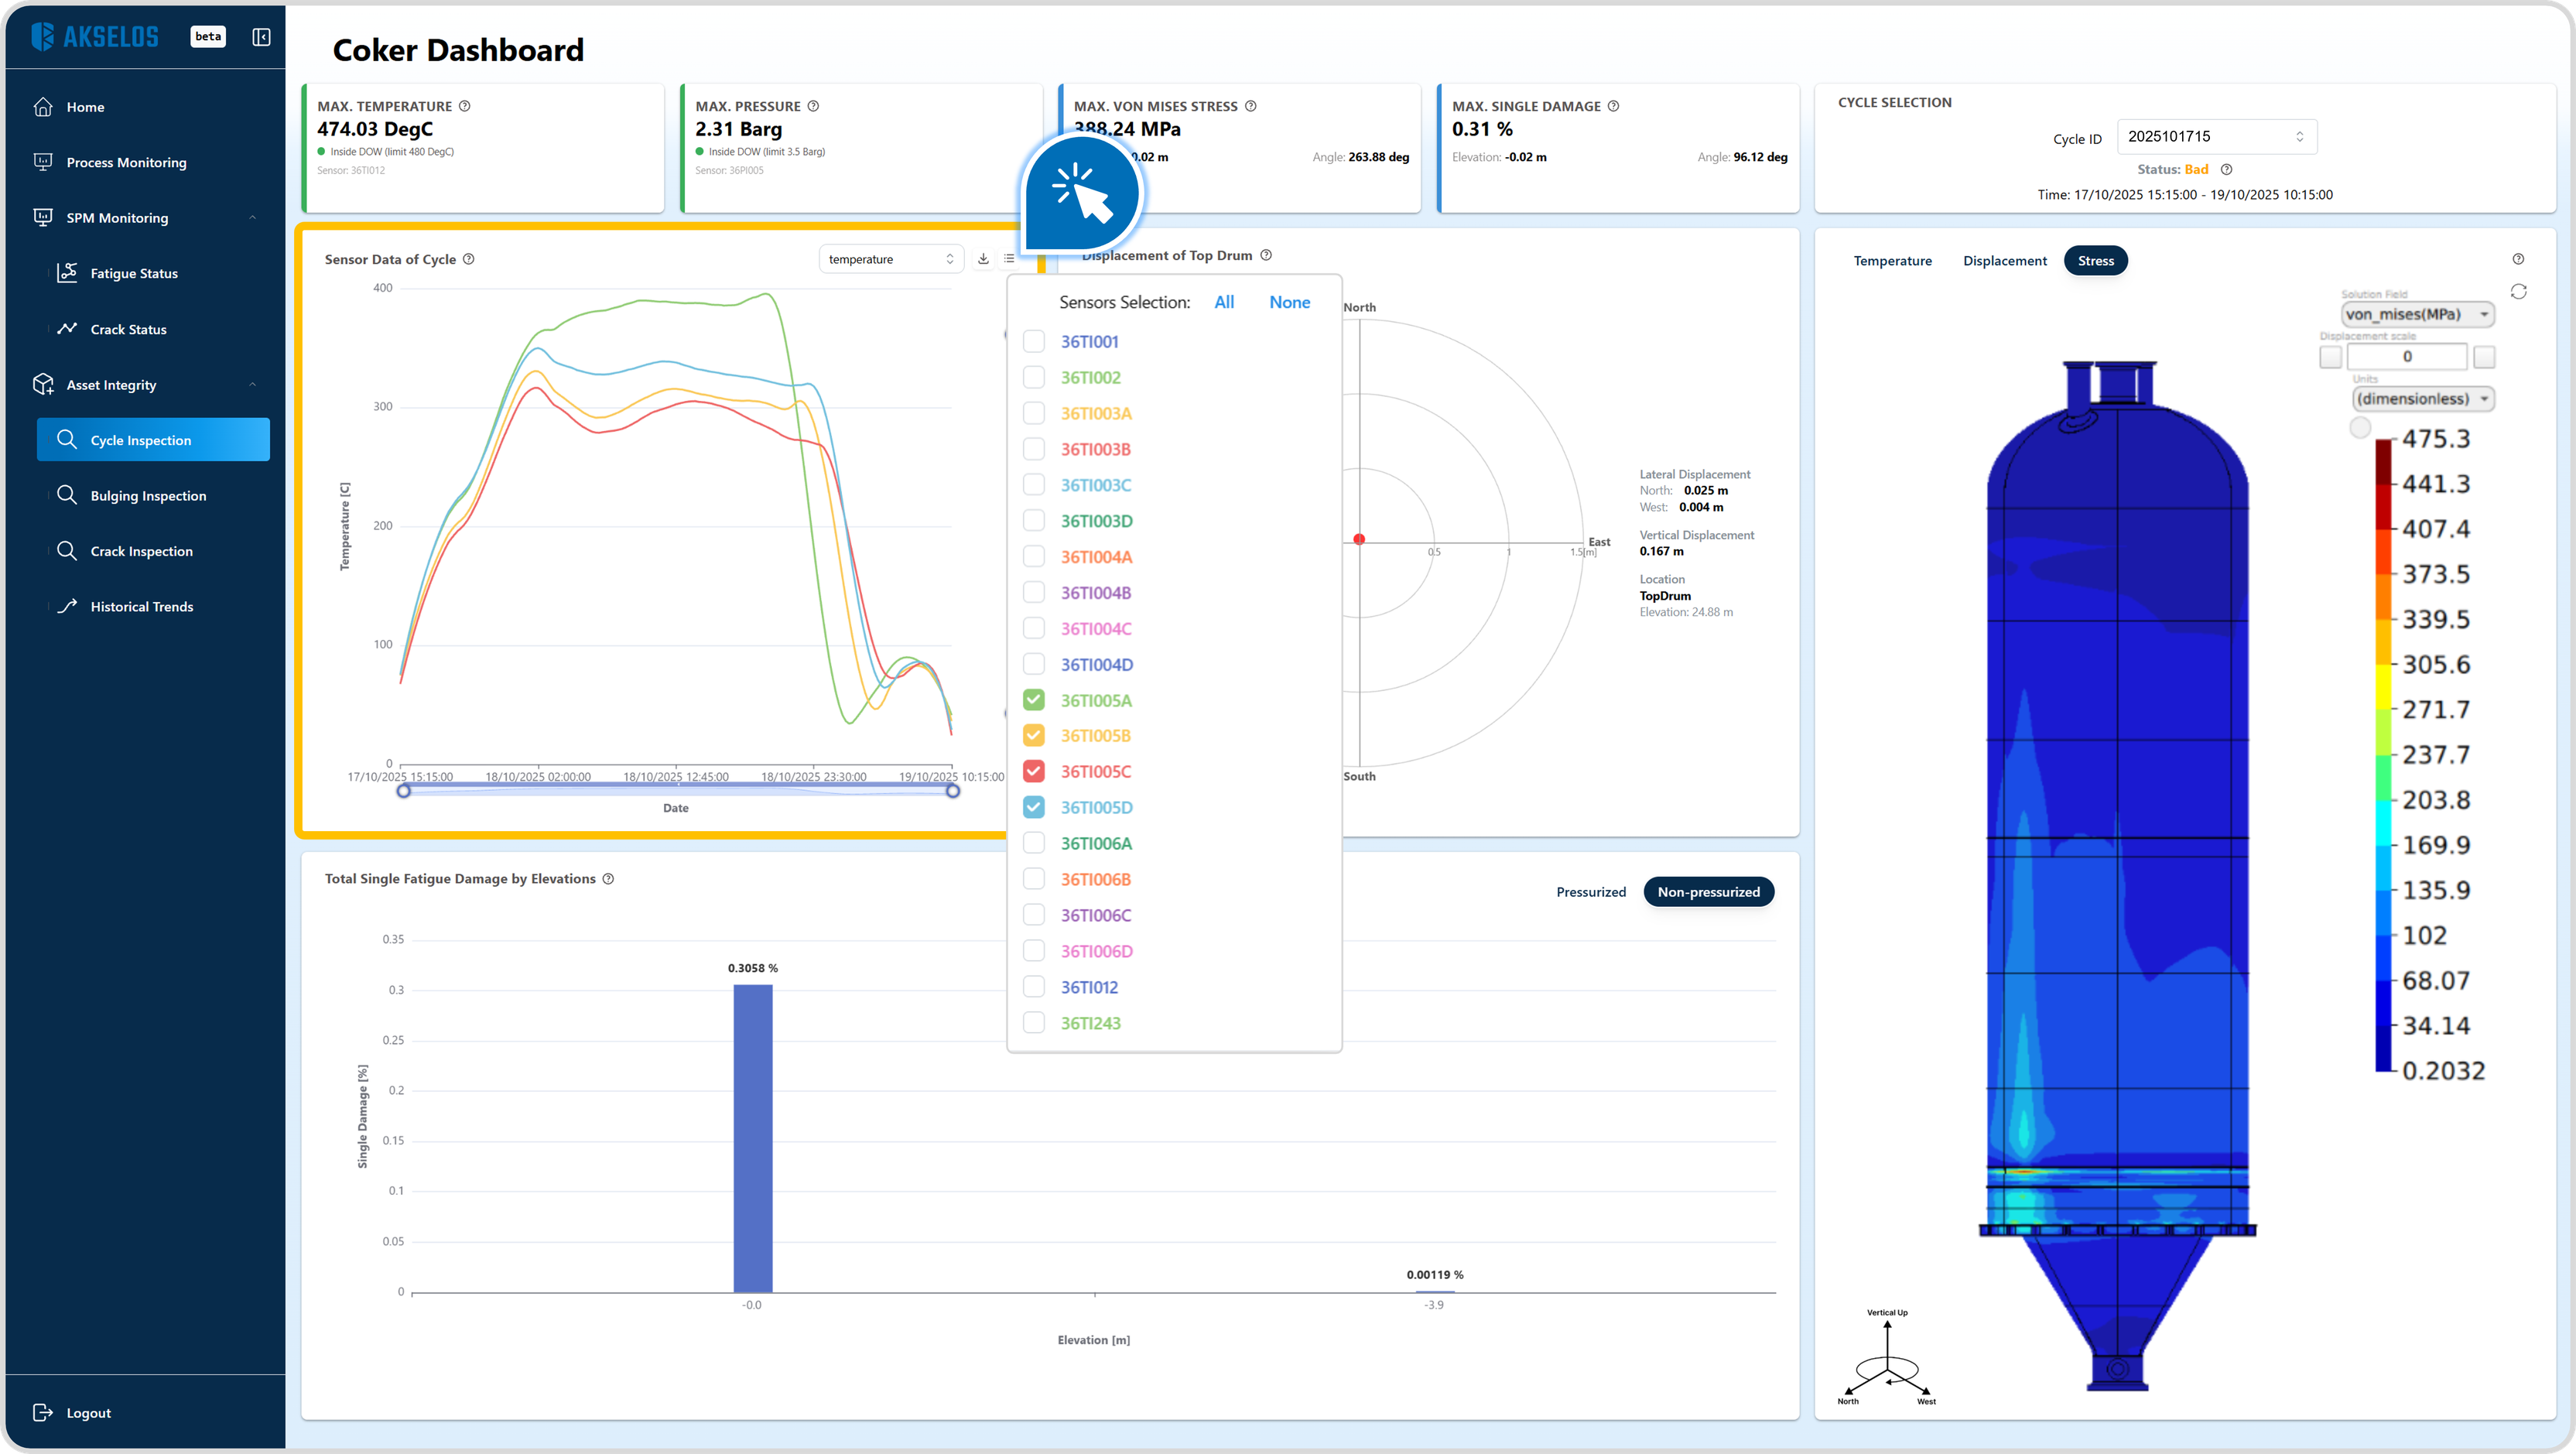
Figure 5. Sensor Data of Cycle, filtered to the sensors at one elevation
The result is a named cycle, its standing against the average, the elevation it damaged, and the sensor readings behind it: the record to bring into a turnaround or process review.
4. Finding Short Cycles with Low Damage
Can the drum run shorter cycles that each use only a small share of drum life?
The cycle record holds part of the answer. Top 10 Best Cycles ranks every recorded cycle by the damage it caused on its own, lowest first, and the dates of those cycles set the period to examine. Historical Trends adds cycle length: it plots every cycle by how long it ran and the damage it caused, and lets the user set a User Defined Optimal Range of cycle length, from a minimum to a maximum in hours, together with a User Defined High Damage line. The shaded band marks the cycles of the chosen length, so the lowest dots inside it are the short cycles with low damage. Cycle Inspection then shows the record behind each of them.
To find past cycles that were short and caused little fatigue damage, follow these steps:
- In the navigation panel, expand SPM Monitoring, select Fatigue Status, and scroll down to Top 10 Best Cycles. The table ranks every cycle in the full recorded history by Maximum Per-Cycle Damage [%], lowest first, as its subtitle Lowest single-cycle fatigue damage increment states (Figure 6). Note the Cycle ID and Start Date of the cycles of interest; the dates set the period for the next steps.
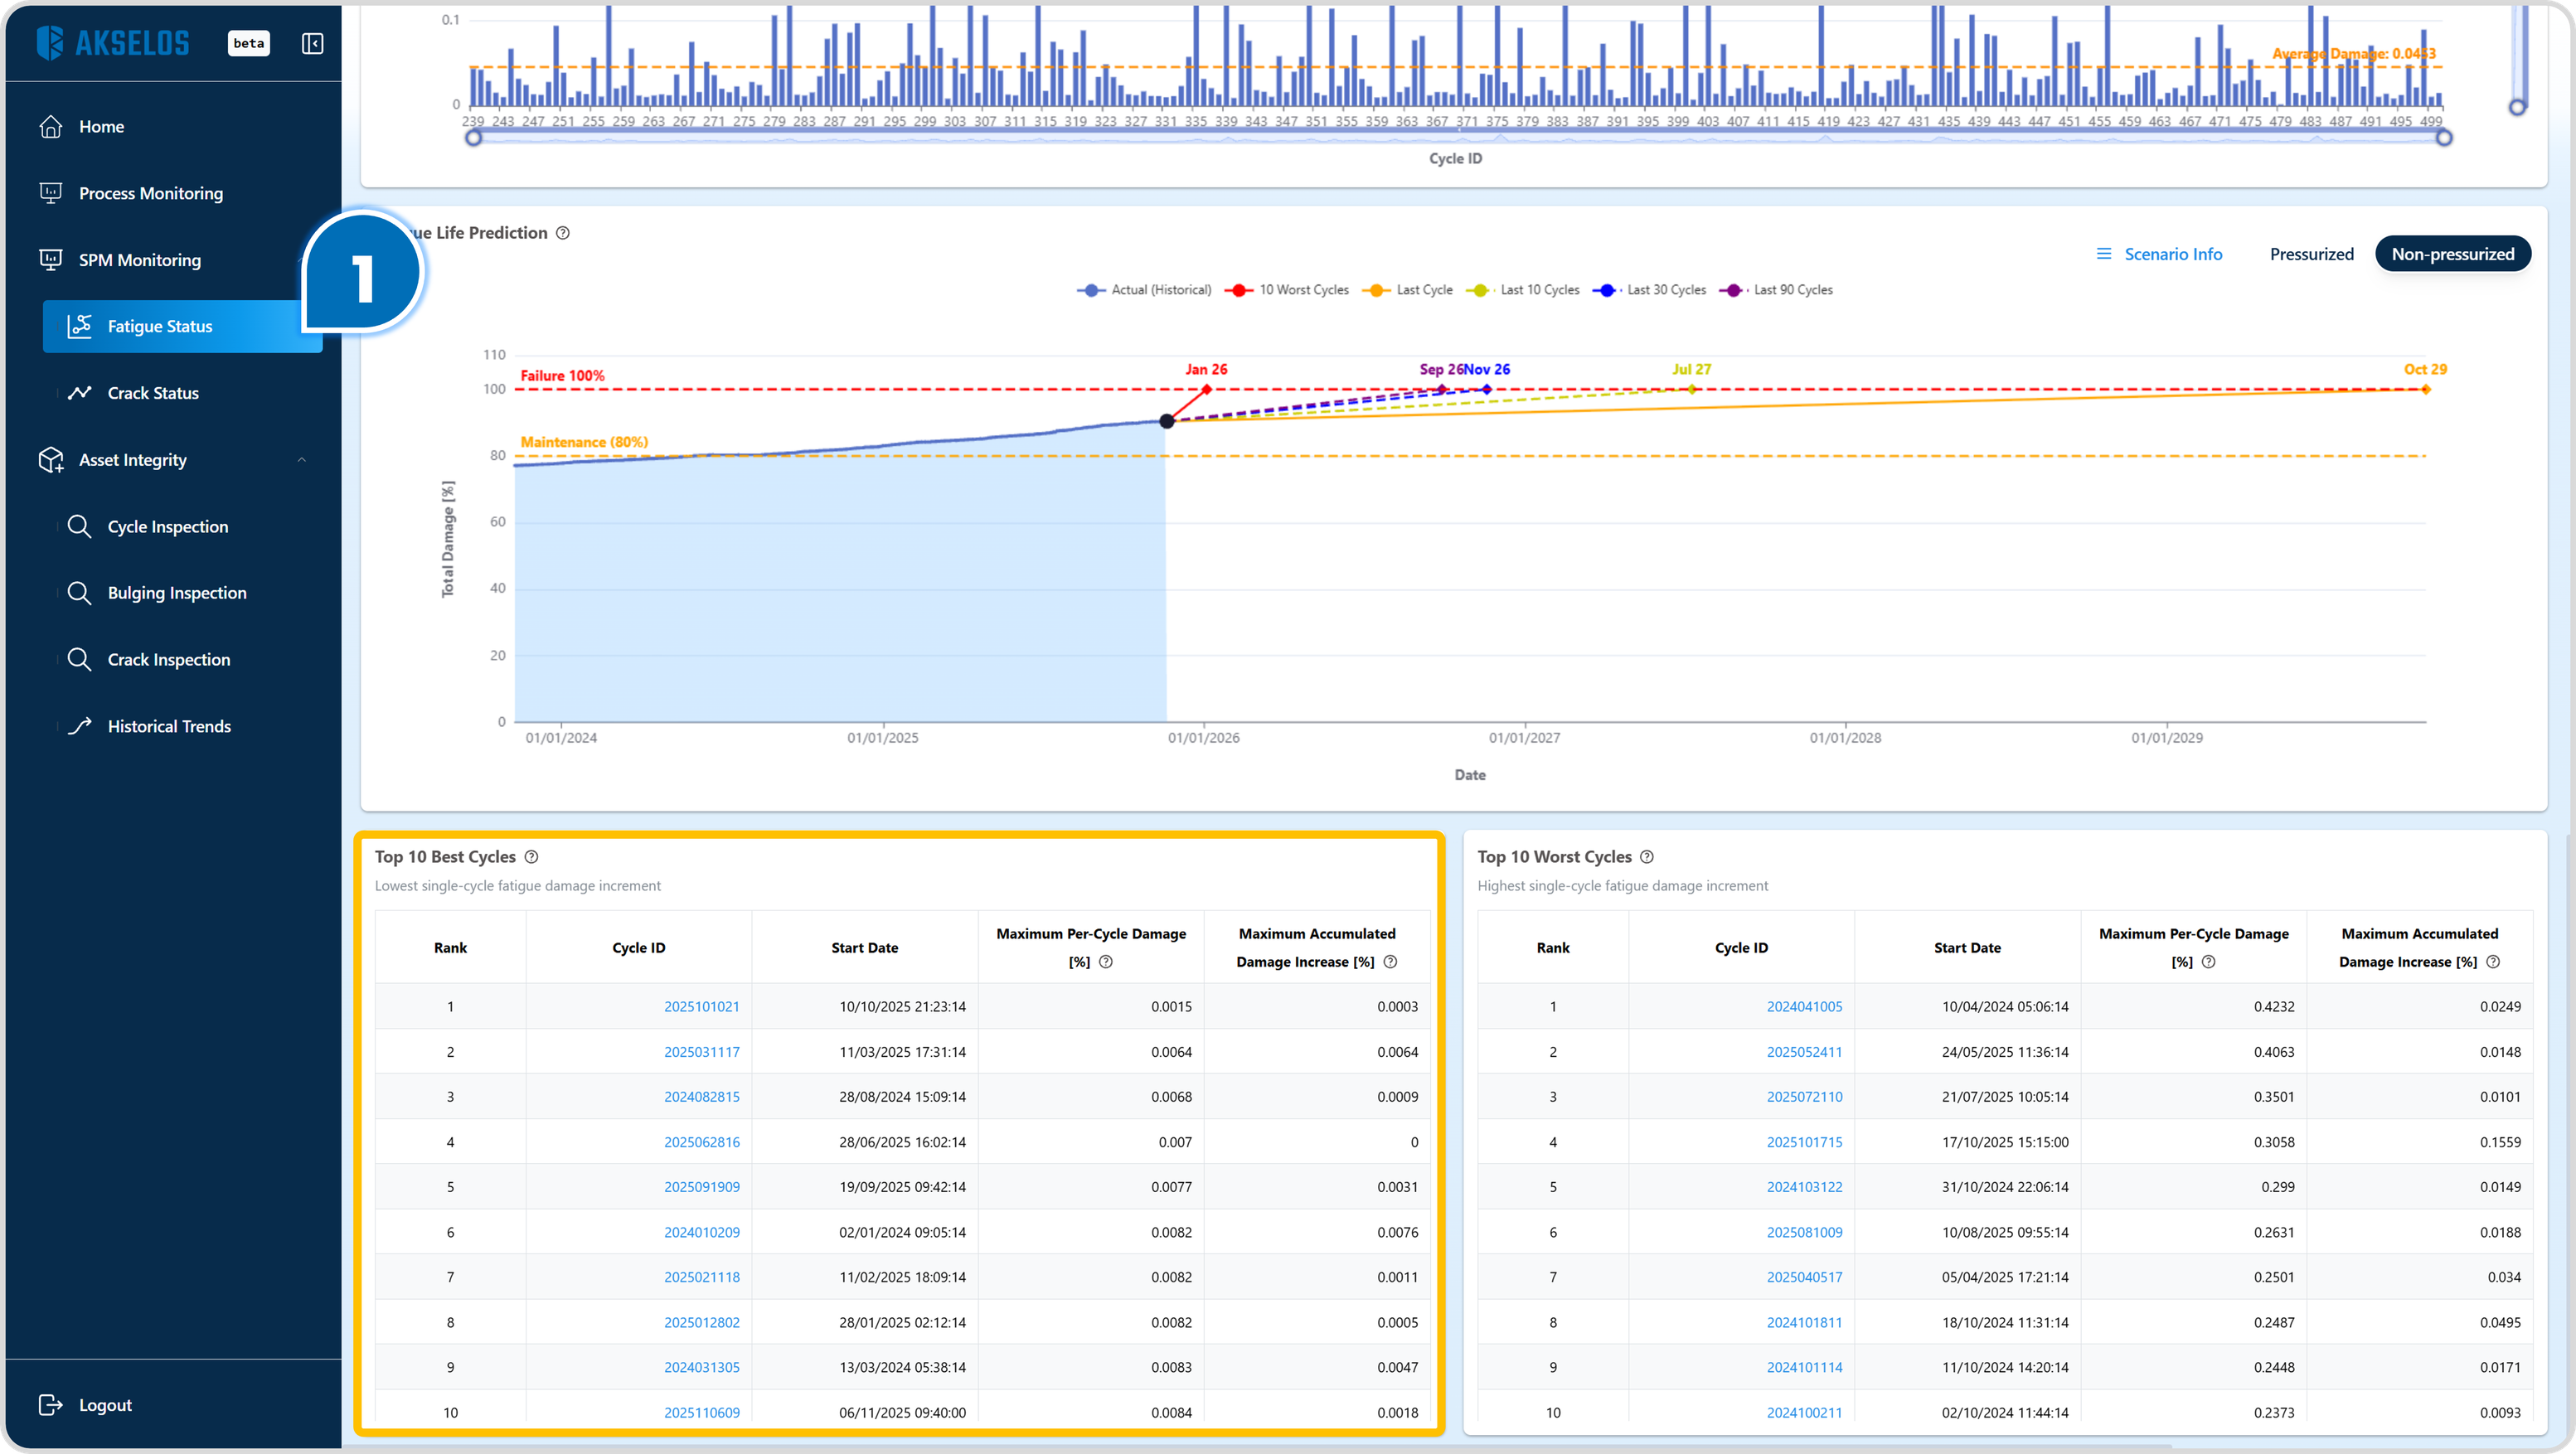
Figure 6. Top 10 Best Cycles, ranked across the full recorded history
- In the navigation panel, expand Asset Integrity and select Historical Trends. Top 10 Best Cycles ranks on damage alone, and this page adds cycle length: it plots every completed cycle by how long it ran and the damage it caused.
- In Select Metric, choose Fatigue Damage and Cycle Length. Enter a period in From and To that covers the start dates noted in step 1, and select Apply. The chart now shows only the cycles in that period, including the candidates.
- Enter User Defined Optimal Min Cycle Length (hours) and User Defined Optimal Max Cycle Length (hours) to shade the band of cycle lengths to compare, enter User Defined High Damage to draw the line above which a cycle counts as high damage, and select Save. The band keeps the comparison to cycles of similar length, and the line marks the cycles above the chosen damage level.
- Inside the band, hover the lowest dots to read their Cycle IDs. A Cycle ID that also appears in Top 10 Best Cycles belongs to a cycle that was both short and low in damage (Figure 7).
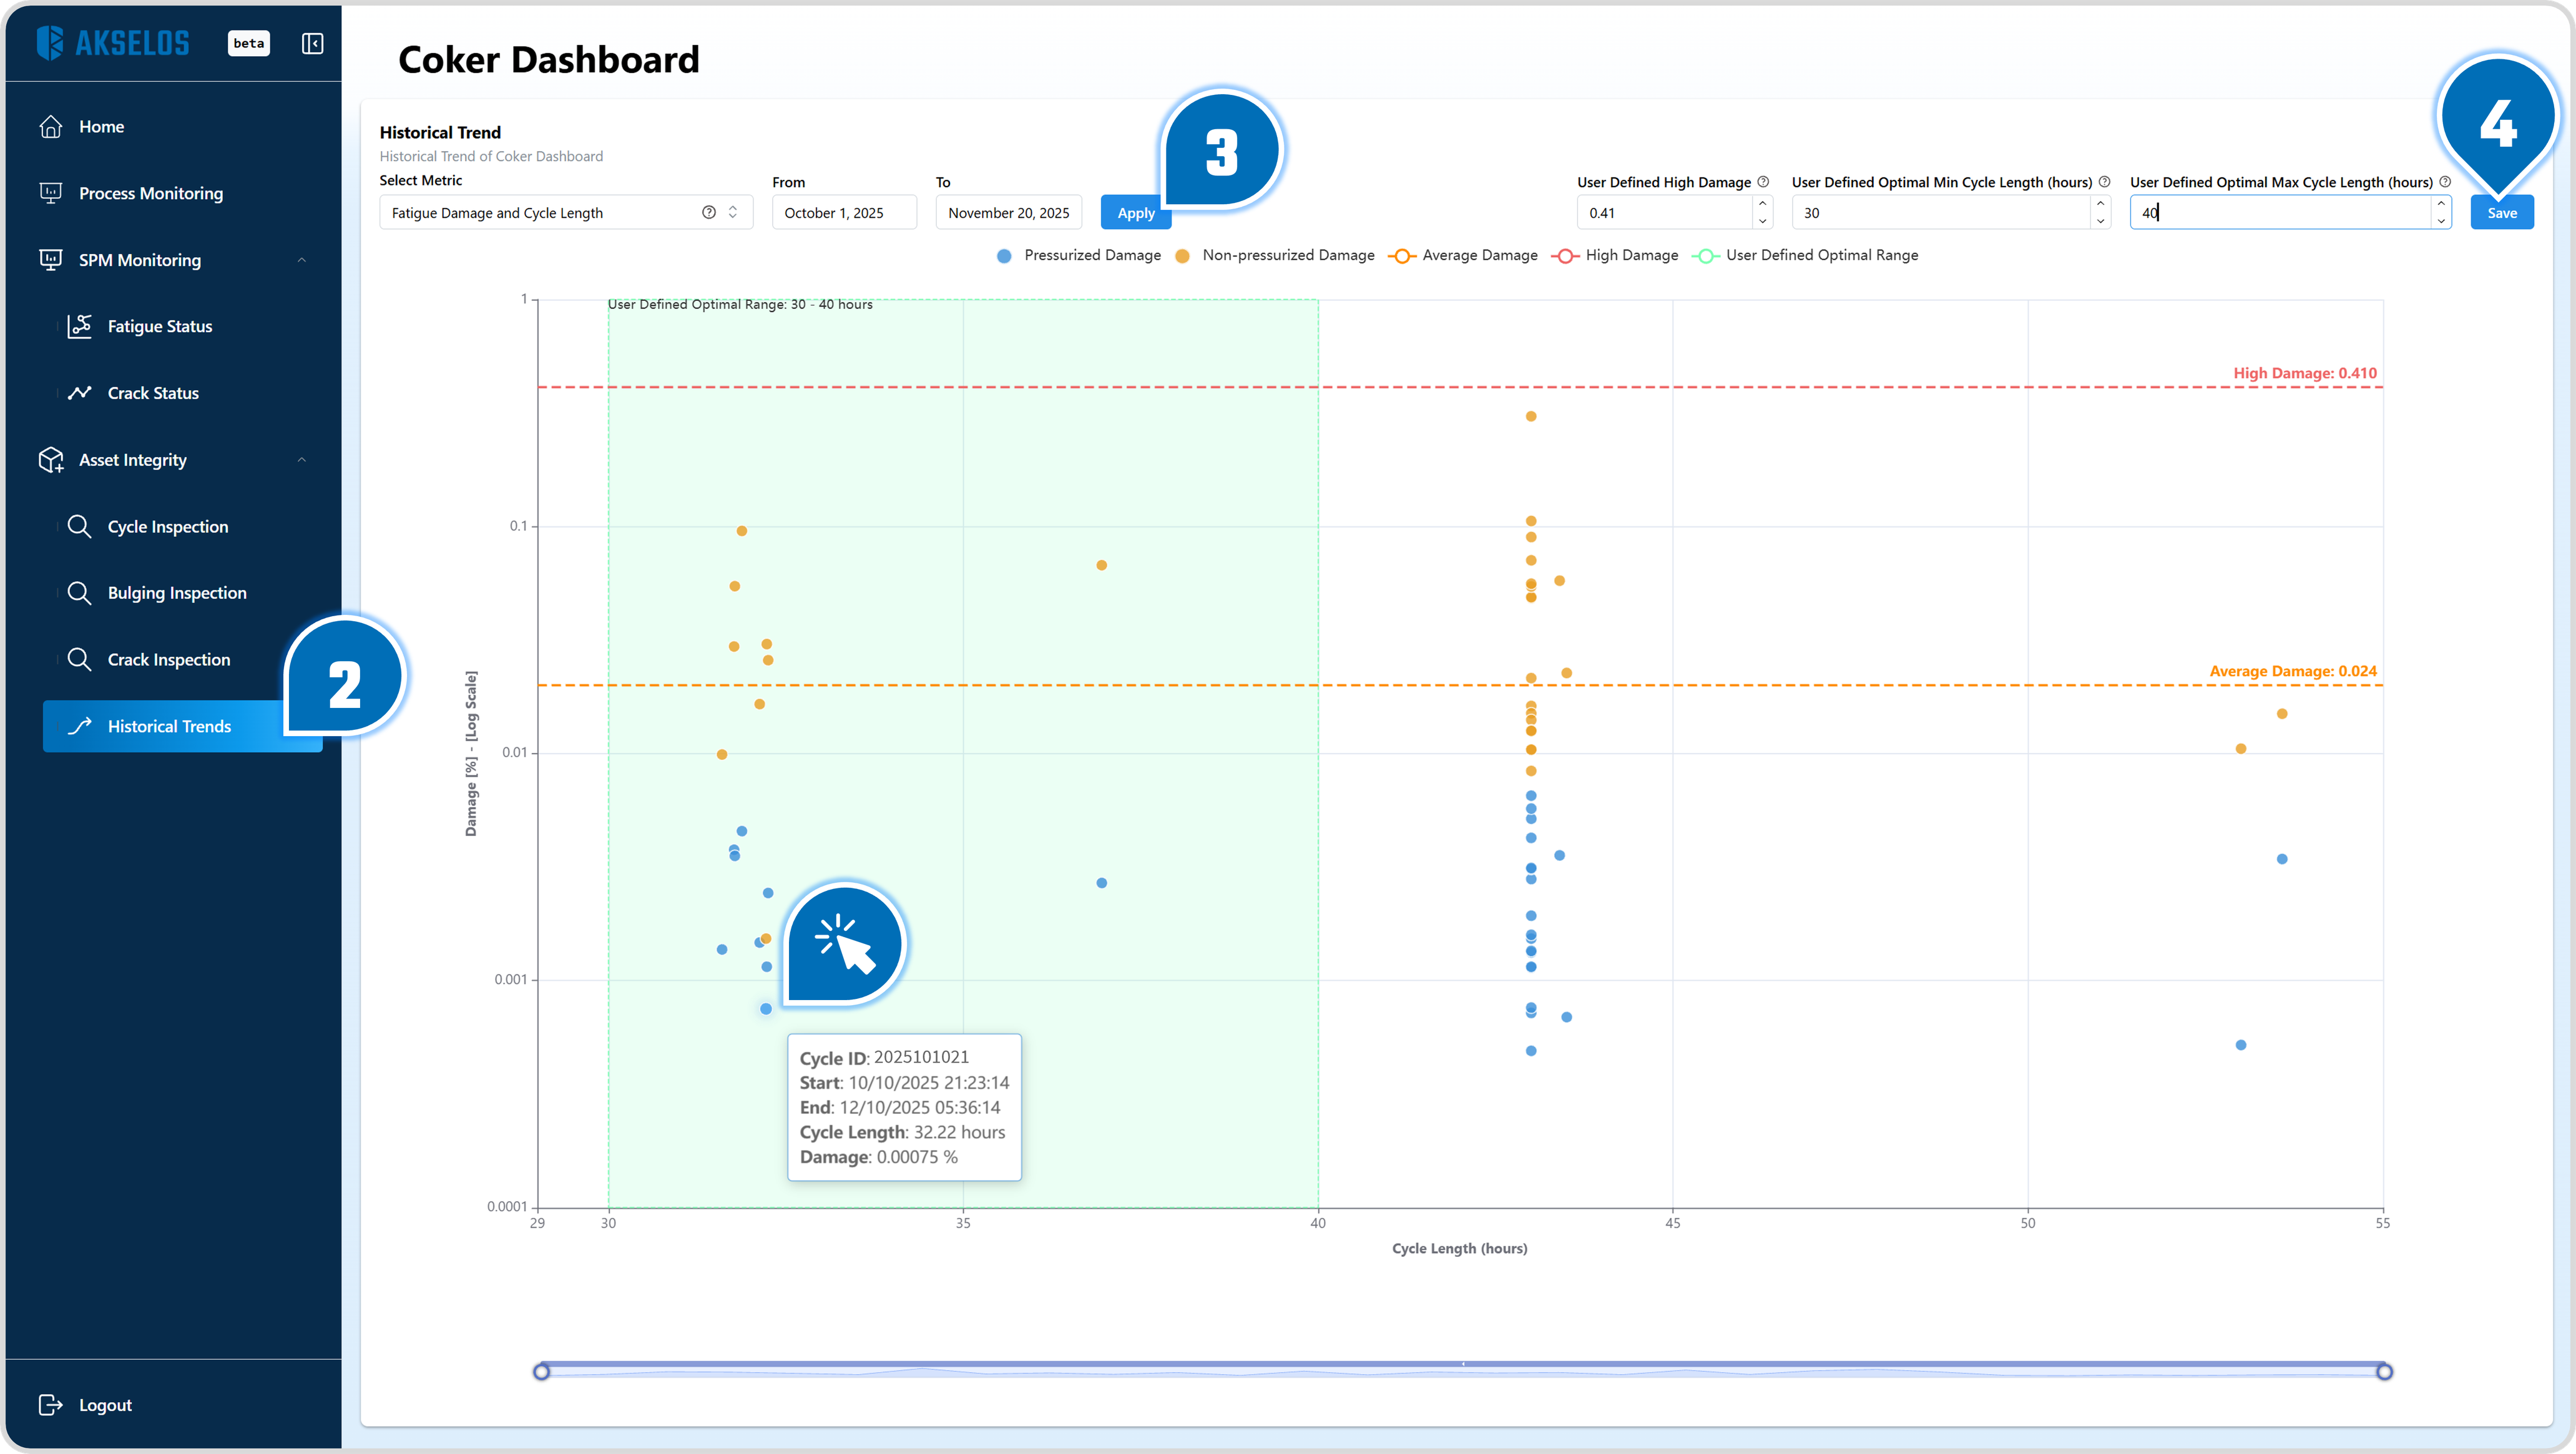
Figure 7. Historical Trends, with the User Defined Optimal Range and the High Damage line applied
- To see what lies behind the result, double-click a candidate dot to open it on Cycle Inspection, then open a high-damage cycle of similar length the same way. Sensor Data of Cycle for the two shows how the record differs between a short cycle with low damage and one with high damage (Figure 8).
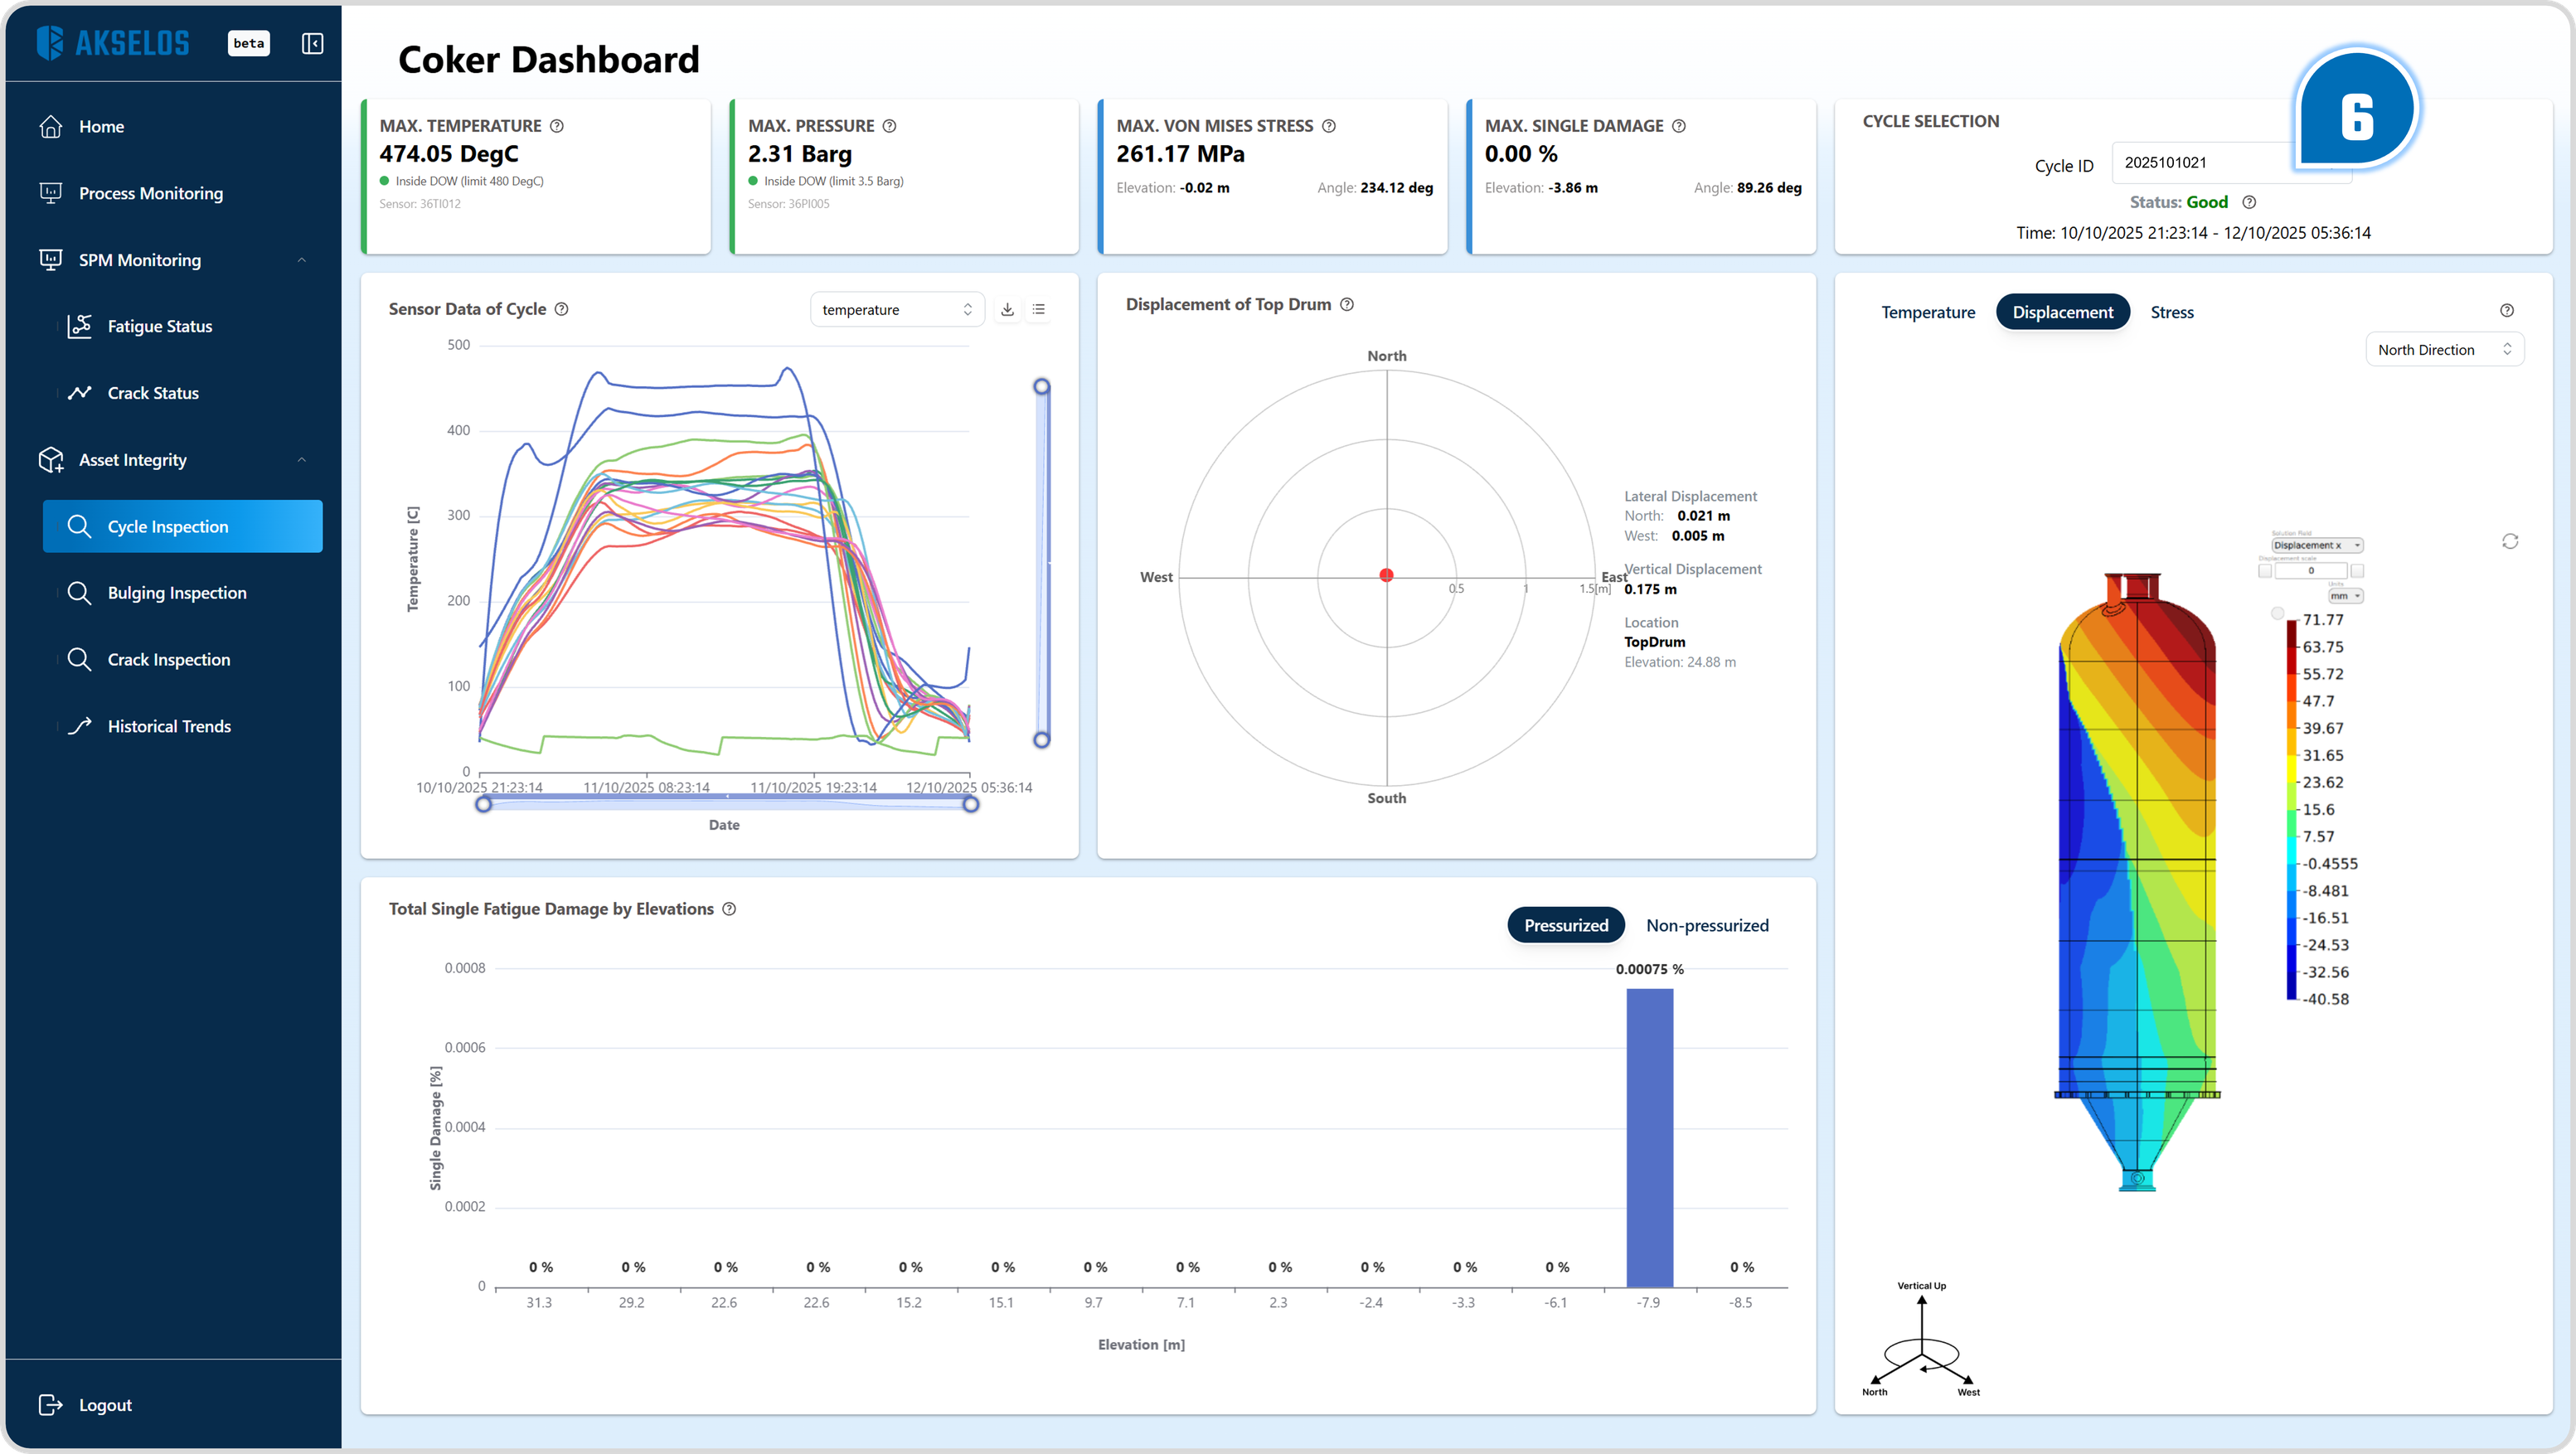
Figure 8. Sensor Data of Cycle on Cycle Inspection for a low-damage candidate
The result is a shortlist of short, low-damage cycles, each set against a high-damage cycle of similar length. Choosing which cycle to treat as a reference rests with whoever holds the operating context. A shorter drum cycle also depends on the connected units keeping pace, from the heater to the coke handling equipment.
5. Where to Go Next
The Coker Dashboard article describes every page and widget used in this tutorial.
The bulging and crack tutorial follows the same shape through an inspection campaign. The methodology article covers how the structural twin is built and how each assessment is calculated.